¶ Overview
The myPower24 Dashboard is a dynamic and responsive grid-based interface that allows users to monitor energy systems through modular components called Widgets. The dashboard provides a highly customisable environment where users can tailor their monitoring experience across multiple screen sizes and hardware configurations.
| Term | Symbol / ID | Definition | Common Use Case |
|---|---|---|---|
| Real Power | W / kW | The actual power consumed by loads to do work (heat, light, motion). |
Measuring actual appliance usage or solar production. |
| Apparent Power | VA / kVA | The total power "flowing" through the circuit (the product of Voltage and Current). |
Determining if an inverter or transformer is reaching its limit. |
| Energy Volume | Wh / kWh | Power used over a period of time (Power x Time). |
Calculating monthly bills or daily solar yield. |
| Reactive Power | VArh | Power that oscillates between the source and load without doing work. |
Advanced industrial monitoring and motor analysis. |
| State of Charge | SoC / sp | The percentage of energy remaining in the battery relative to its capacity. |
Monitoring battery health and reserve levels. |
| Grid Import | GRCP_imp | Energy pulled from the utility provider into your site. |
Tracking reliance on the utility company. |
| Grid Export | GRCP_exp | Excess solar energy sent back to the utility provider. |
Measuring "Feed-in" or wasted excess solar. |
| Rated Power | Rated | The maximum design capacity of a piece of hardware. |
Setting the "100%" mark on visual Power Flow bars. |
| Data Interval | Interval | The frequency at which data points are sampled or averaged. |
Smoothing out "noisy" lines on a historical chart. |
| Yield Prediction | pvP | An estimate of expected solar production based on weather forecasts. |
Planning high-load tasks (laundry, pumping) for peak sun. |
| Load Prediction | ldP | Forecasted energy demand based on historical usage patterns. |
Managing battery reserves to ensure power lasts through the night. |
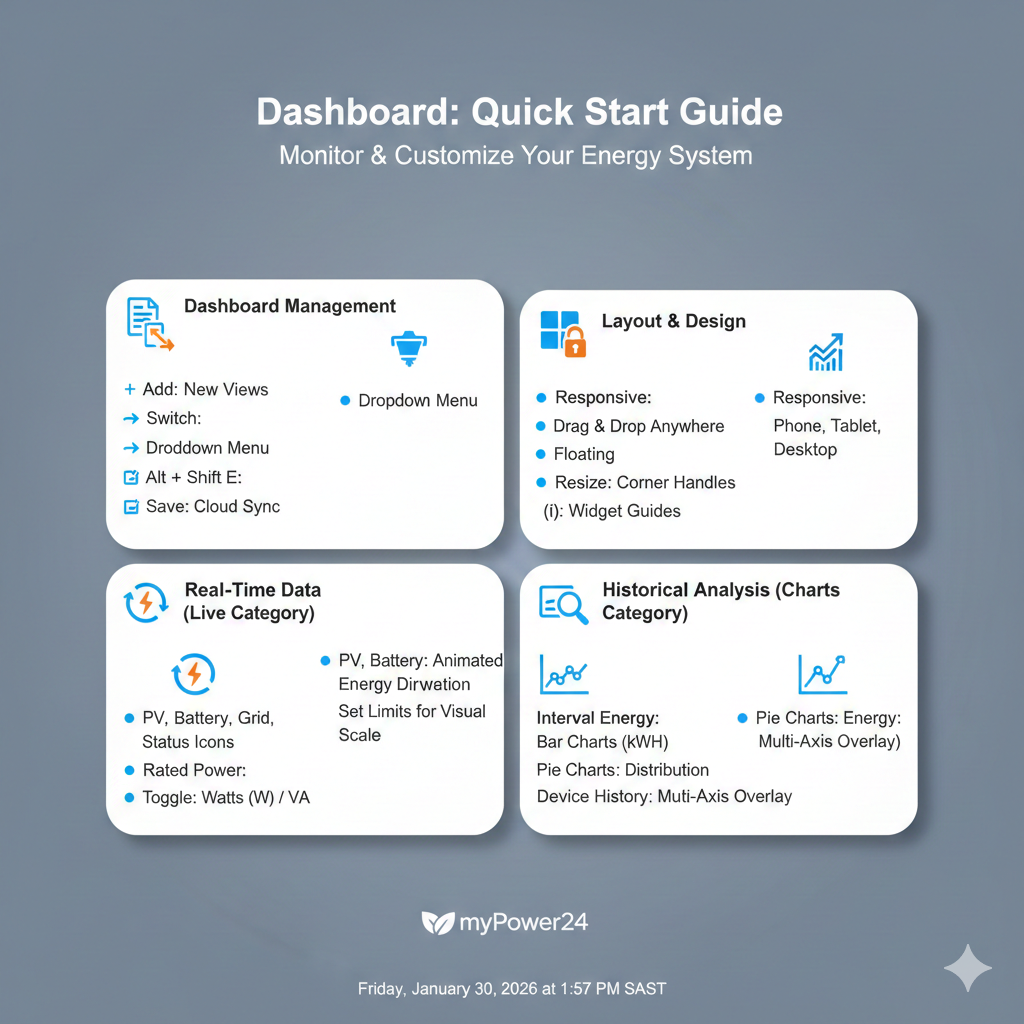
¶ Dashboard Management
Users can maintain a logical flow of information by managing multiple dashboard views.
- Adding: Create new dashboards via the Settings sidebar. Use the "Add Before" or "Add After" options to control the sequence of your views.
- Removing: Delete unused dashboards through the settings panel. Note: The system requires at least one active dashboard at all times.
- Switching: Use the Title Dropdown at the top of the screen to quickly navigate between different saved dashboard views without entering Edit Mode.
- Auto-Update: Toggle the global refresh timer (defaulting to 600 seconds) to ensure all active widgets update their data points simultaneously.
- Saving: Critical for data persistence. Any changes to layout, titles, or widget settings must be committed using the Save Icon (Diskette) to prevent data loss upon browser refresh.
¶ Layout & Arranging
The dashboard utilizes a "Floating Grid" logic to ensure your most important data is exactly where you want it.
- Edit Mode: Triggered by the Pen Icon or
Alt + Shift + E. This mode unlocks dragging and resizing handles on all widgets. - Responsive Grids: Layouts are saved independently for different devices. You must arrange your widgets for each breakpoint:
- Small (4-col): Mobile | Medium (6-col): Tablet | Large (10-col): Laptop | XL (12-col): Desktop.
- Floating Widgets: Widgets stay exactly where they are dropped (
float: true). They do not "snap" to the top, allowing for custom grouping and white space.
¶ The Widget Ecosystem
Widgets are the building blocks of your dashboard. They are discovered and managed through the Widget Add Wizard (Gallery), accessible via the center (+) icon or the sidebar.
¶ General Widget Rules
- The Header: Every widget includes a title and an Info Button (i) that deep-links to specific technical documentation.
- Settings: Many widgets feature an internal Cog Icon for granular configuration (e.g., toggling specific data series or setting "Rated Power" limits).
- Removal: While in Edit Mode, use the (X) handle to remove a widget from the grid.
¶ Widget Categories
- Category: Live Data: Real-time indicators including the Power Flow animation and status icons for PV, Battery, Grid, and Load. These require "Rated Power" inputs for accurate visual scaling.
- Category: Charts: Advanced analytical tools including Power and Live line charts, Interval Energy bar charts, and proportional Donut Charts (Grid Flow, Battery Flow, and Load Analysis).
- Category: System: Specialized monitoring for Digital Inputs (dynamic scaling), System Variables (tabbed controls), and the Energy Report generator for PDF exporting.