¶ 1. Introduction
This guide provides step-by-step instructions for adding and configuring external devices within the myPower24 management platform using the LoggerV series data logger. The aim is to ensure seamless real-time monitoring and plant control for your energy system.
¶ 2. Accessing the Platform
- Sign In: Open myPower24 and sign in using your registered email and password.
- Getting Started: If you do not have an account or require assistance with initial setup, please refer to the Getting Started guide.
¶ 3. Adding a New Device
Follow these steps to integrate a new hardware component into your system:
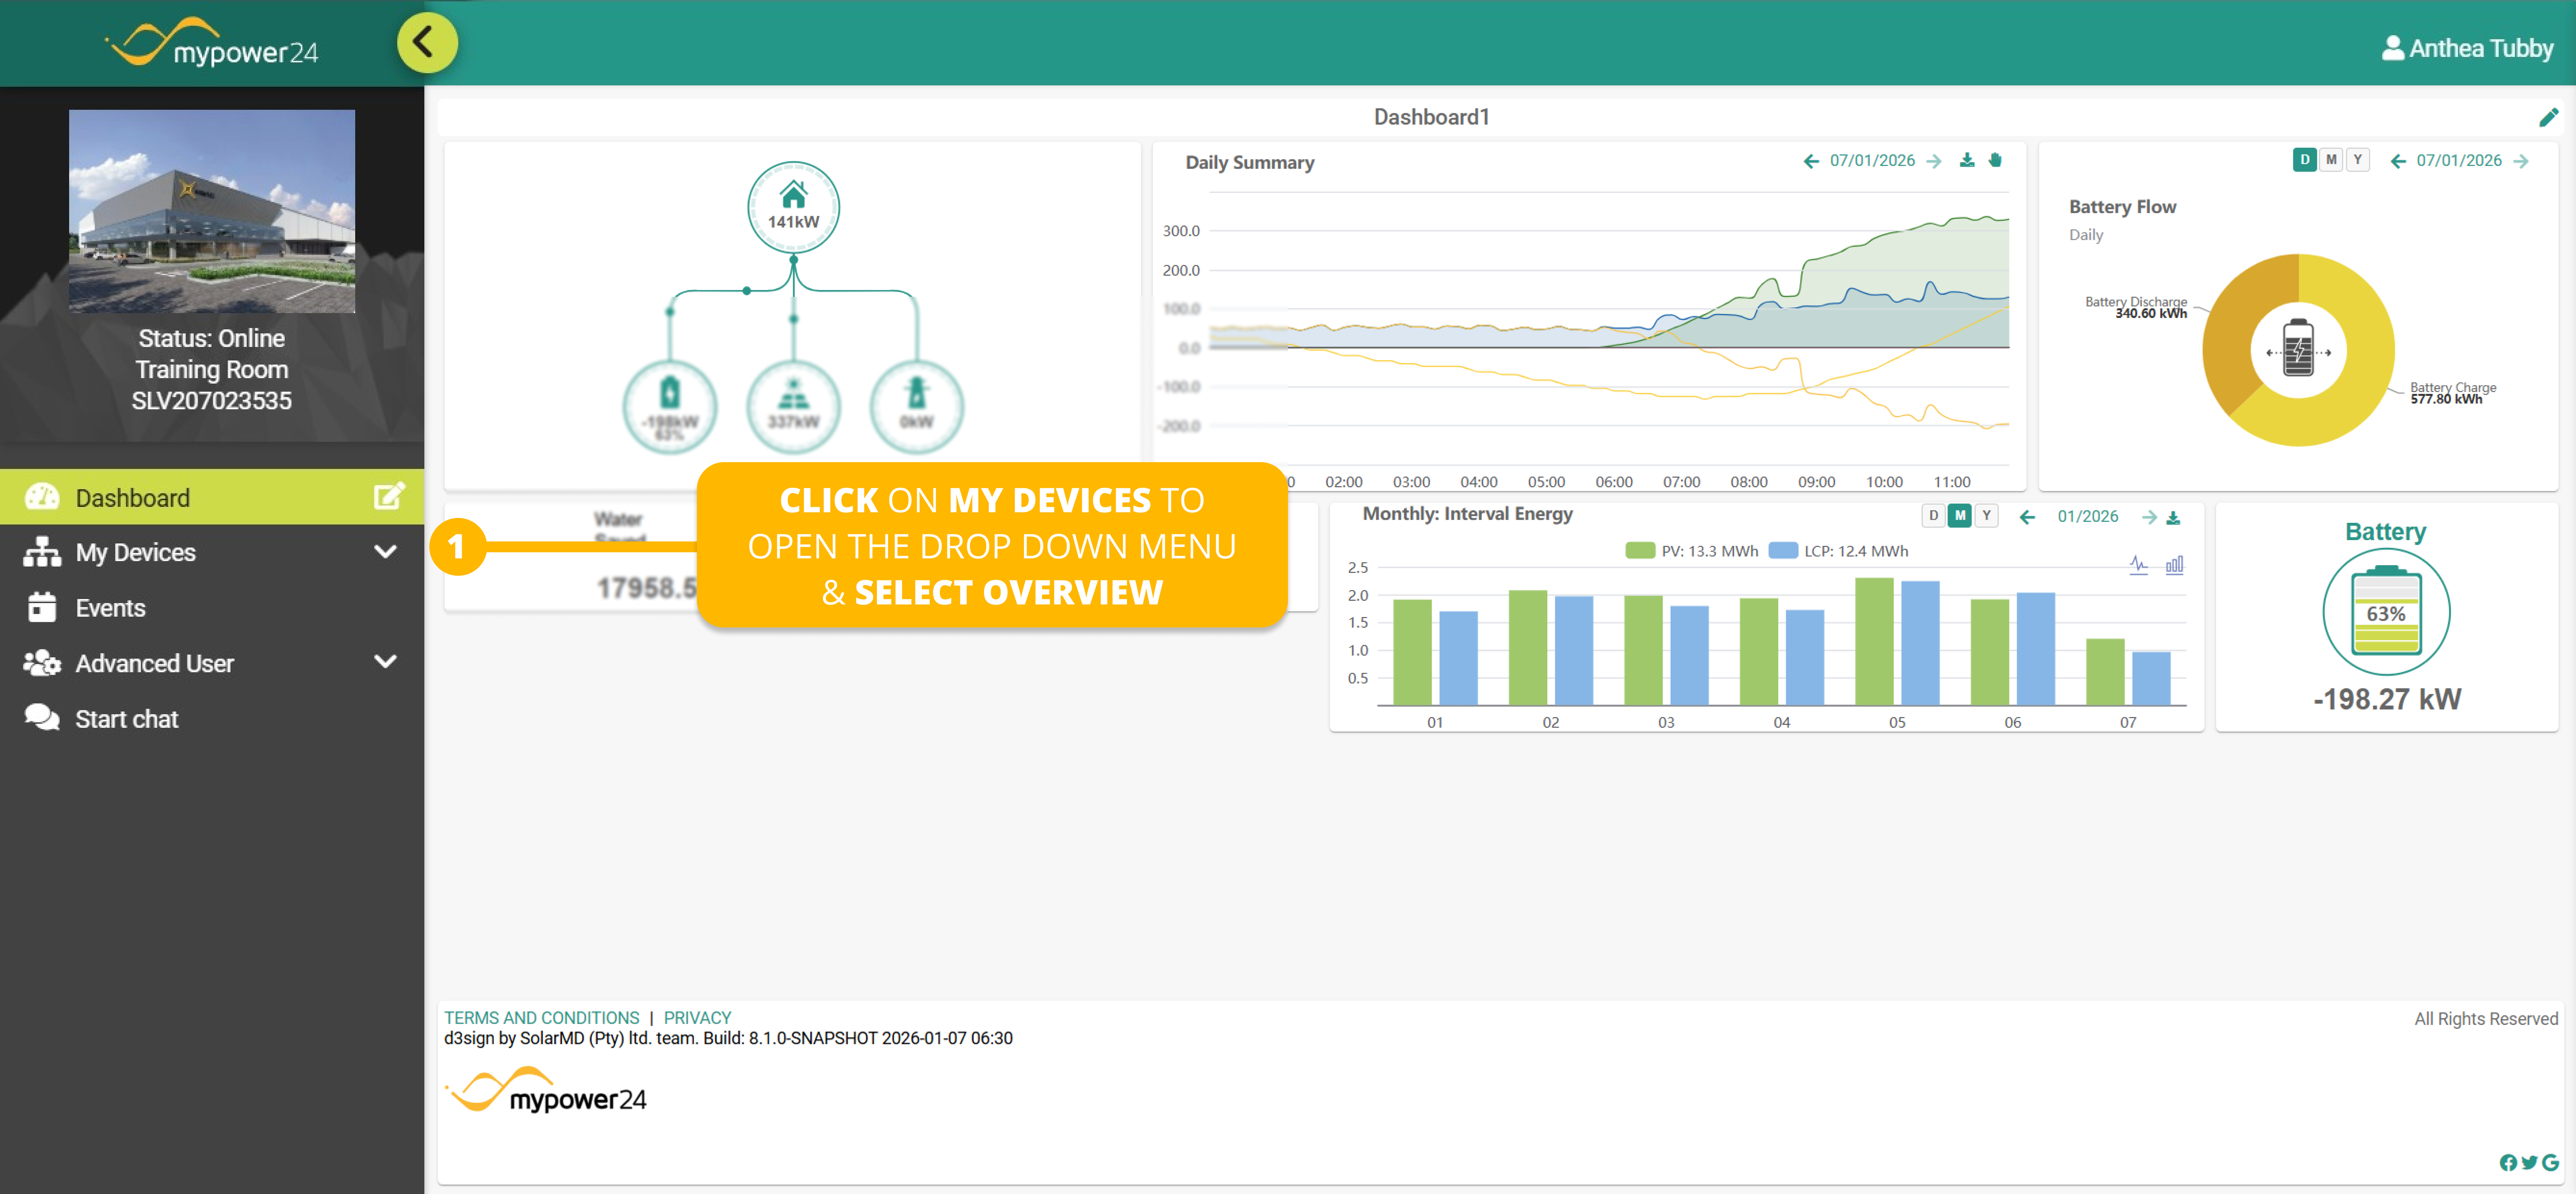
Note: The left sidebar provides navigation while the main dashboard displays your system data.
- Navigate to Overview: On the far-left sidebar, click on My Devices to open the drop down menue and select Overview
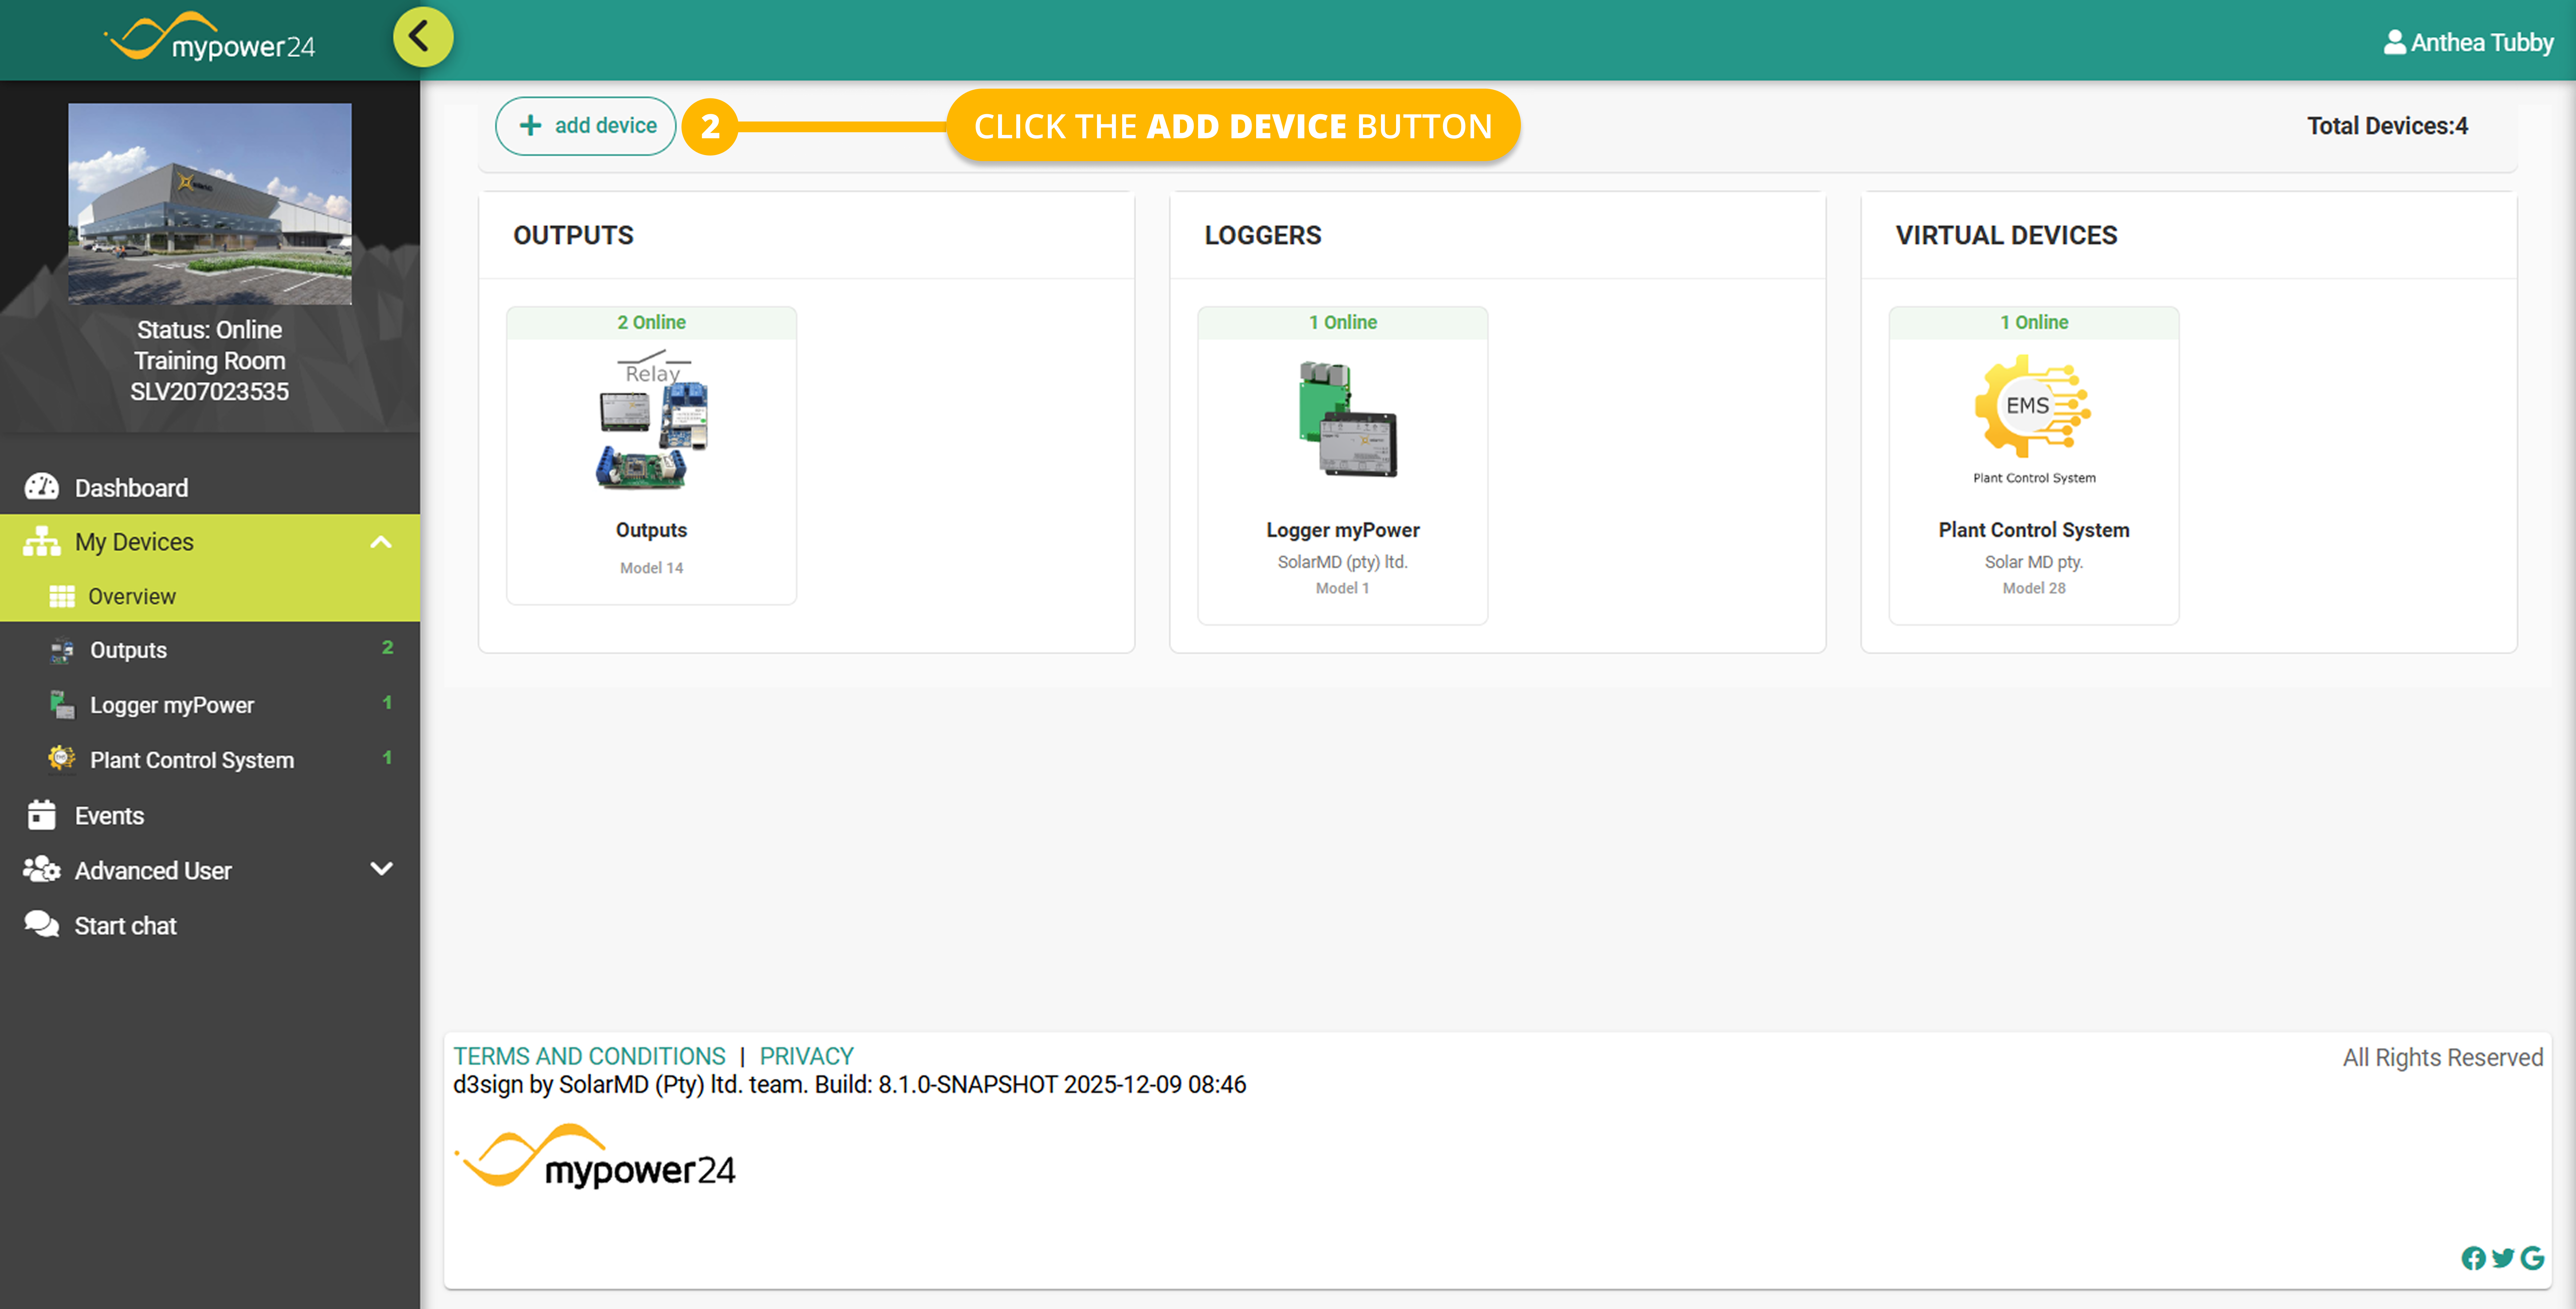
- Initiate Add Device: In the Overview window, click the + add device button located at the top of the screen.
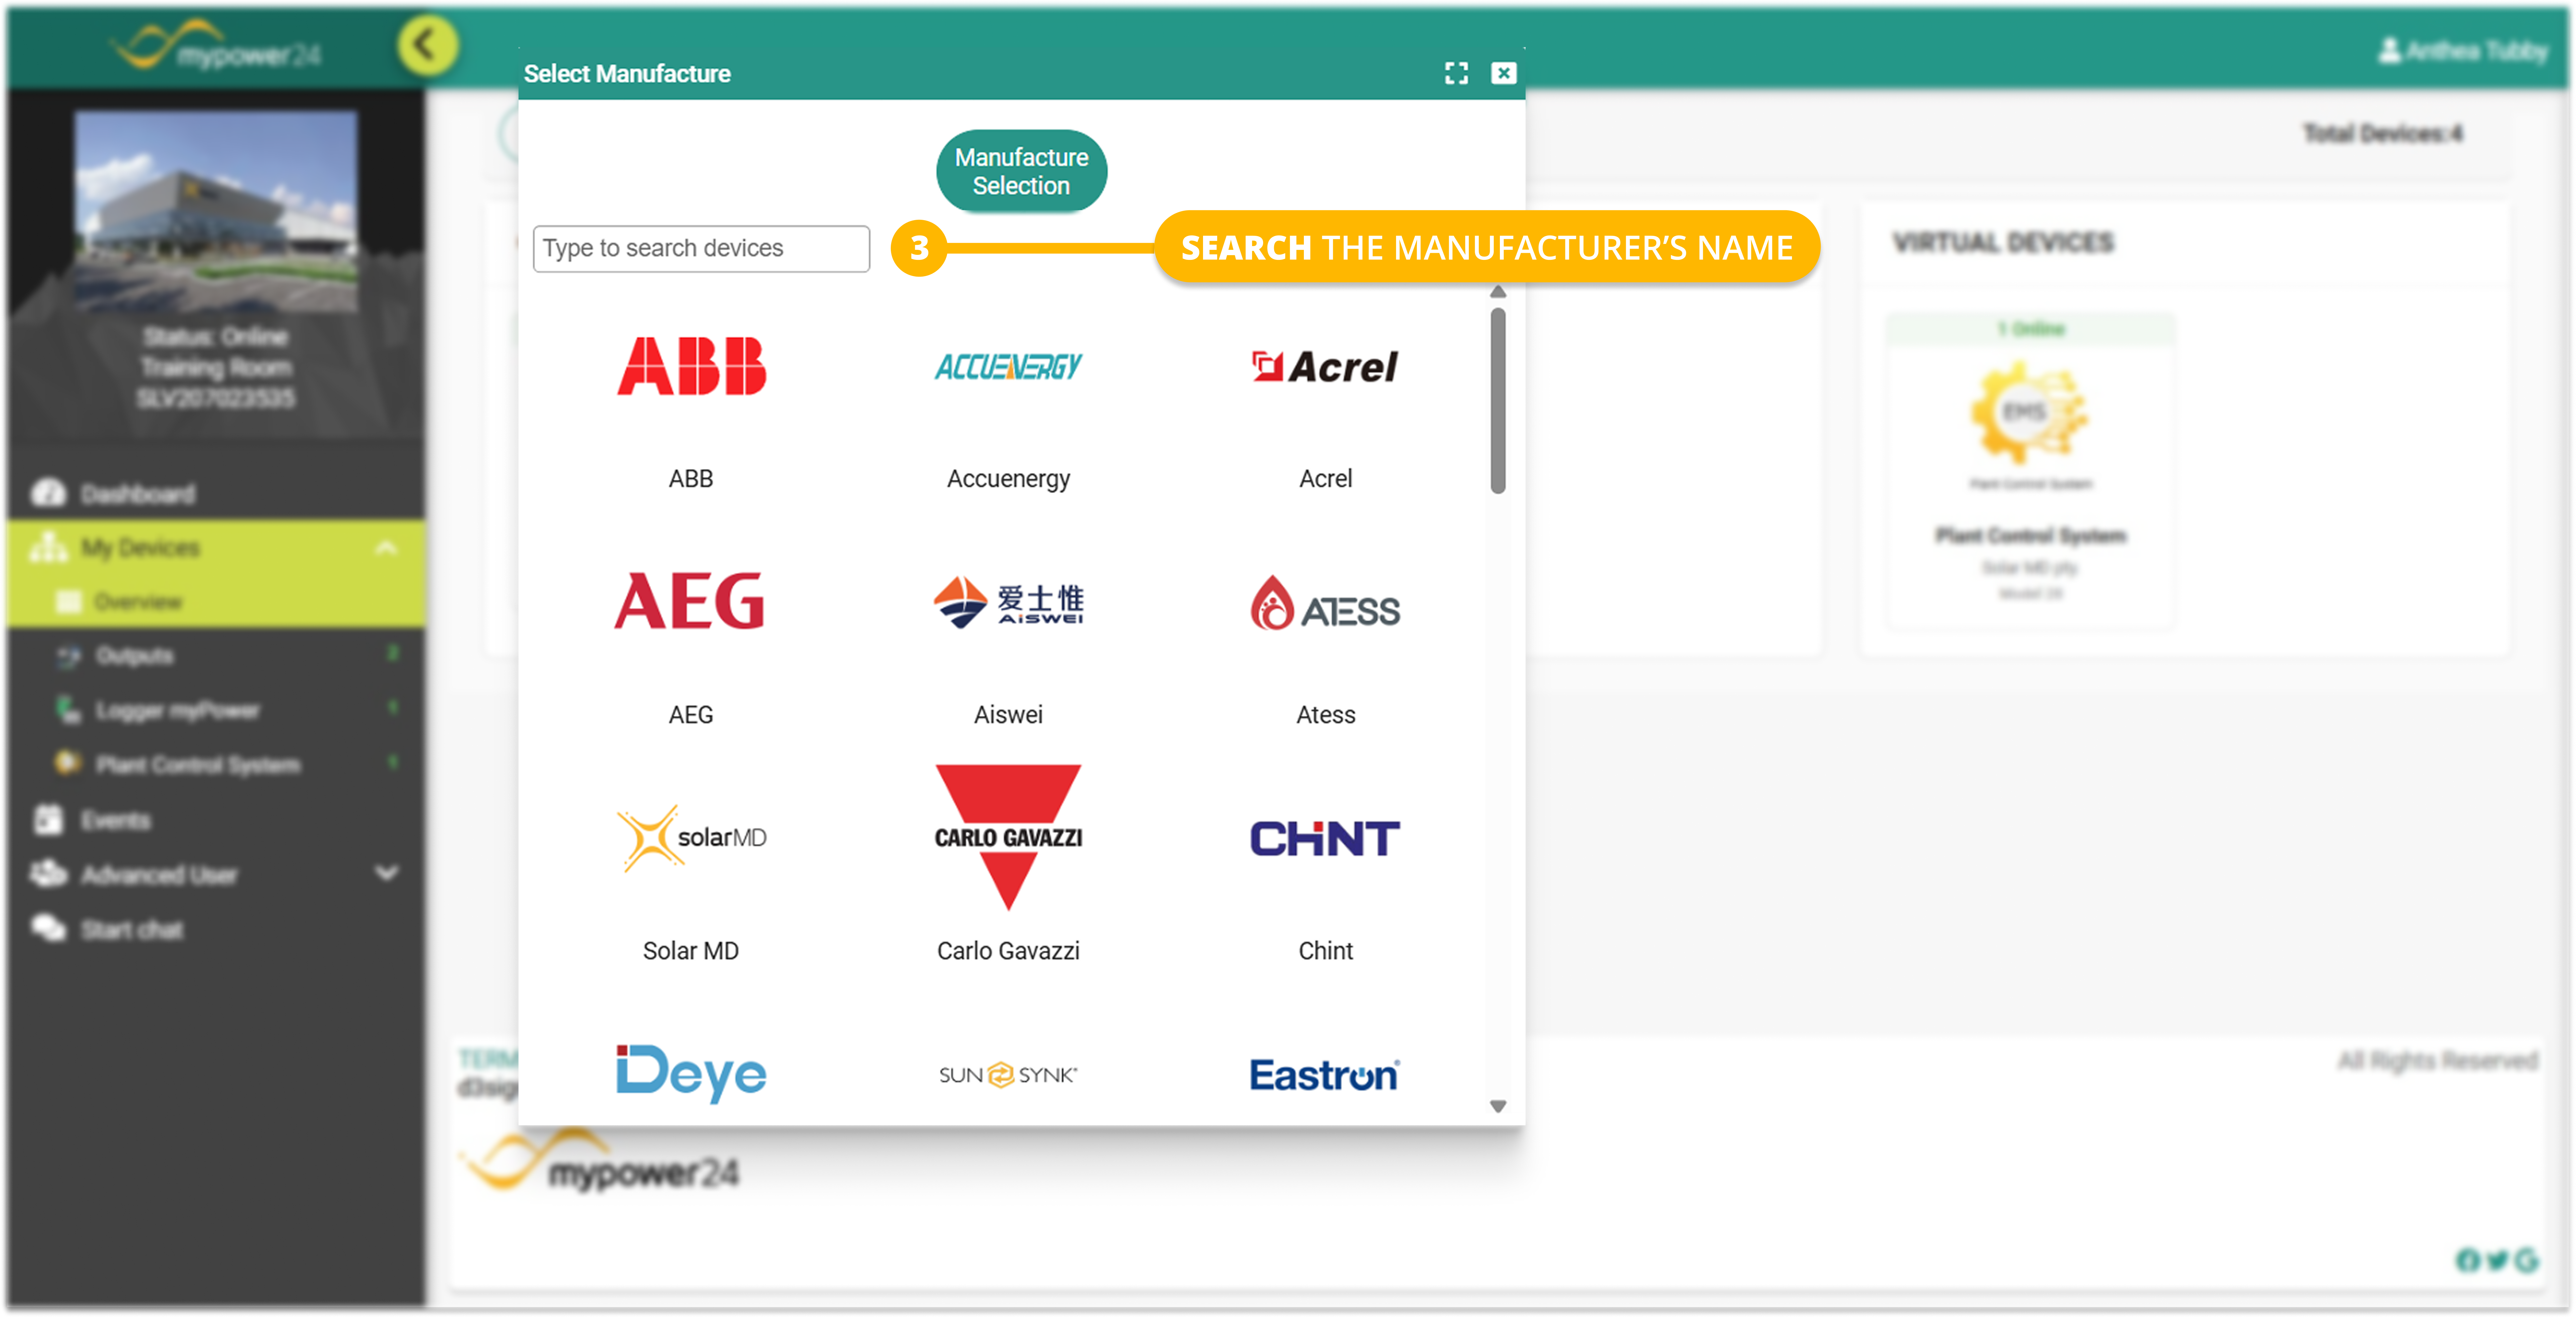
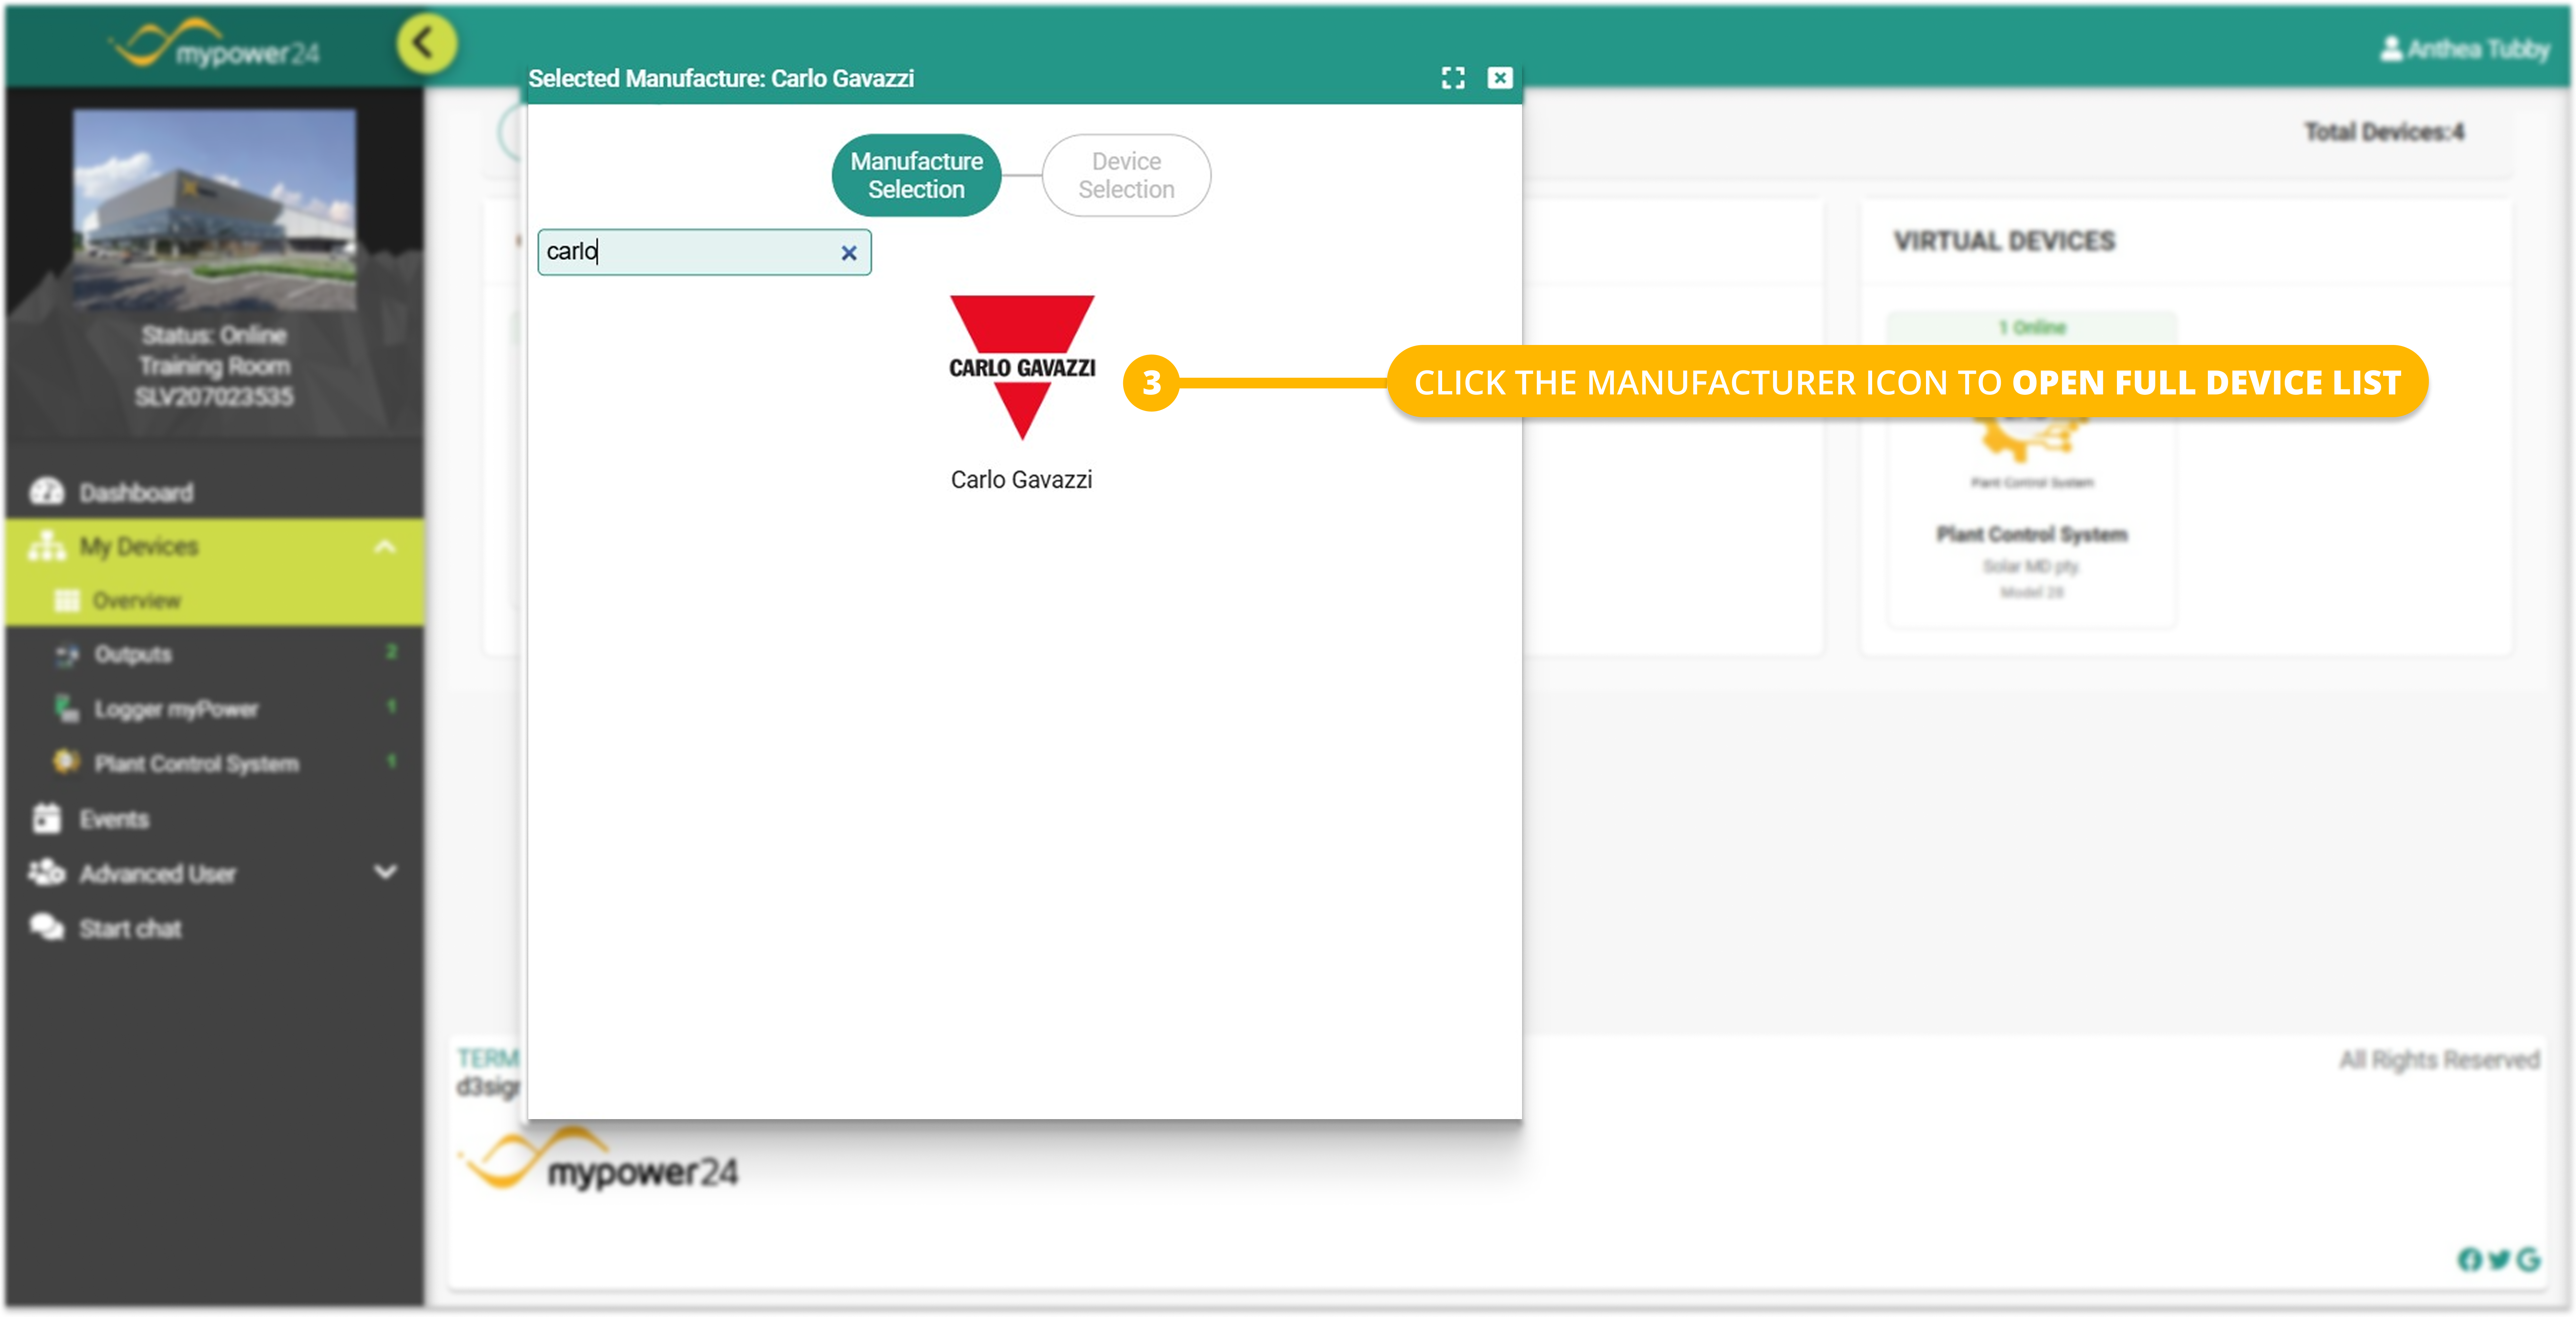
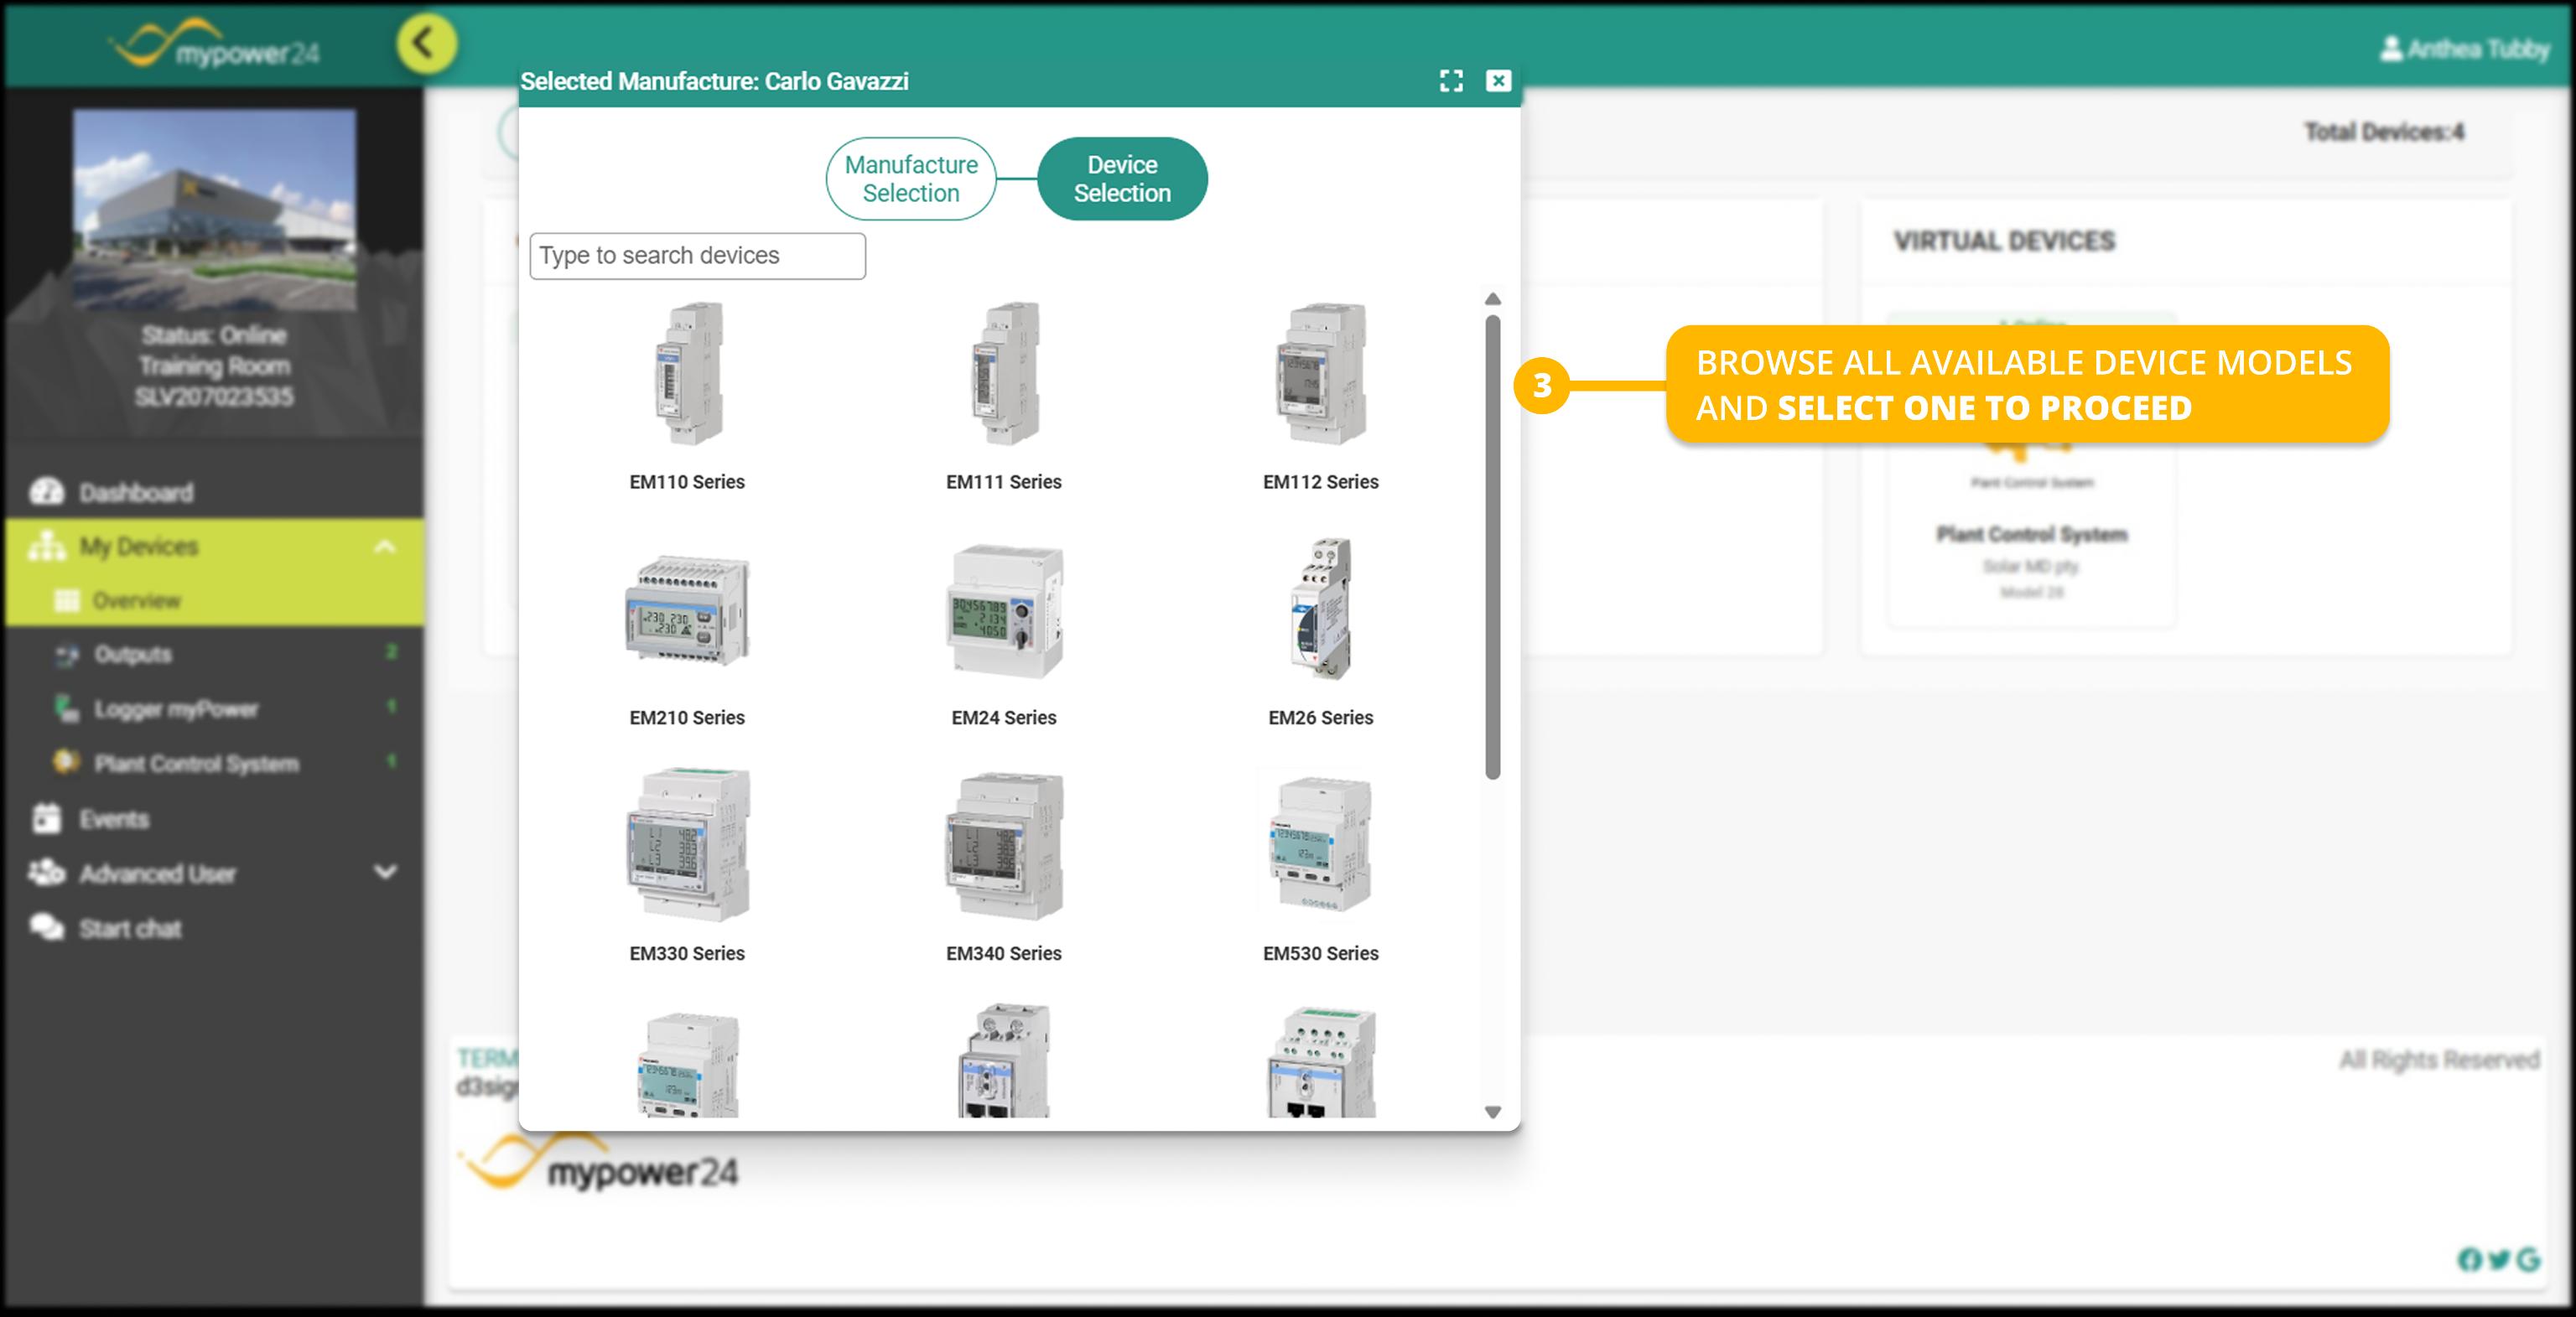
- Manufacturer Selection: A configuration wizard will appear. Use the search bar to find and select the Manufacturer of your device (e.g., Huawei, Kehua, or SMA). Then select the device model in question.
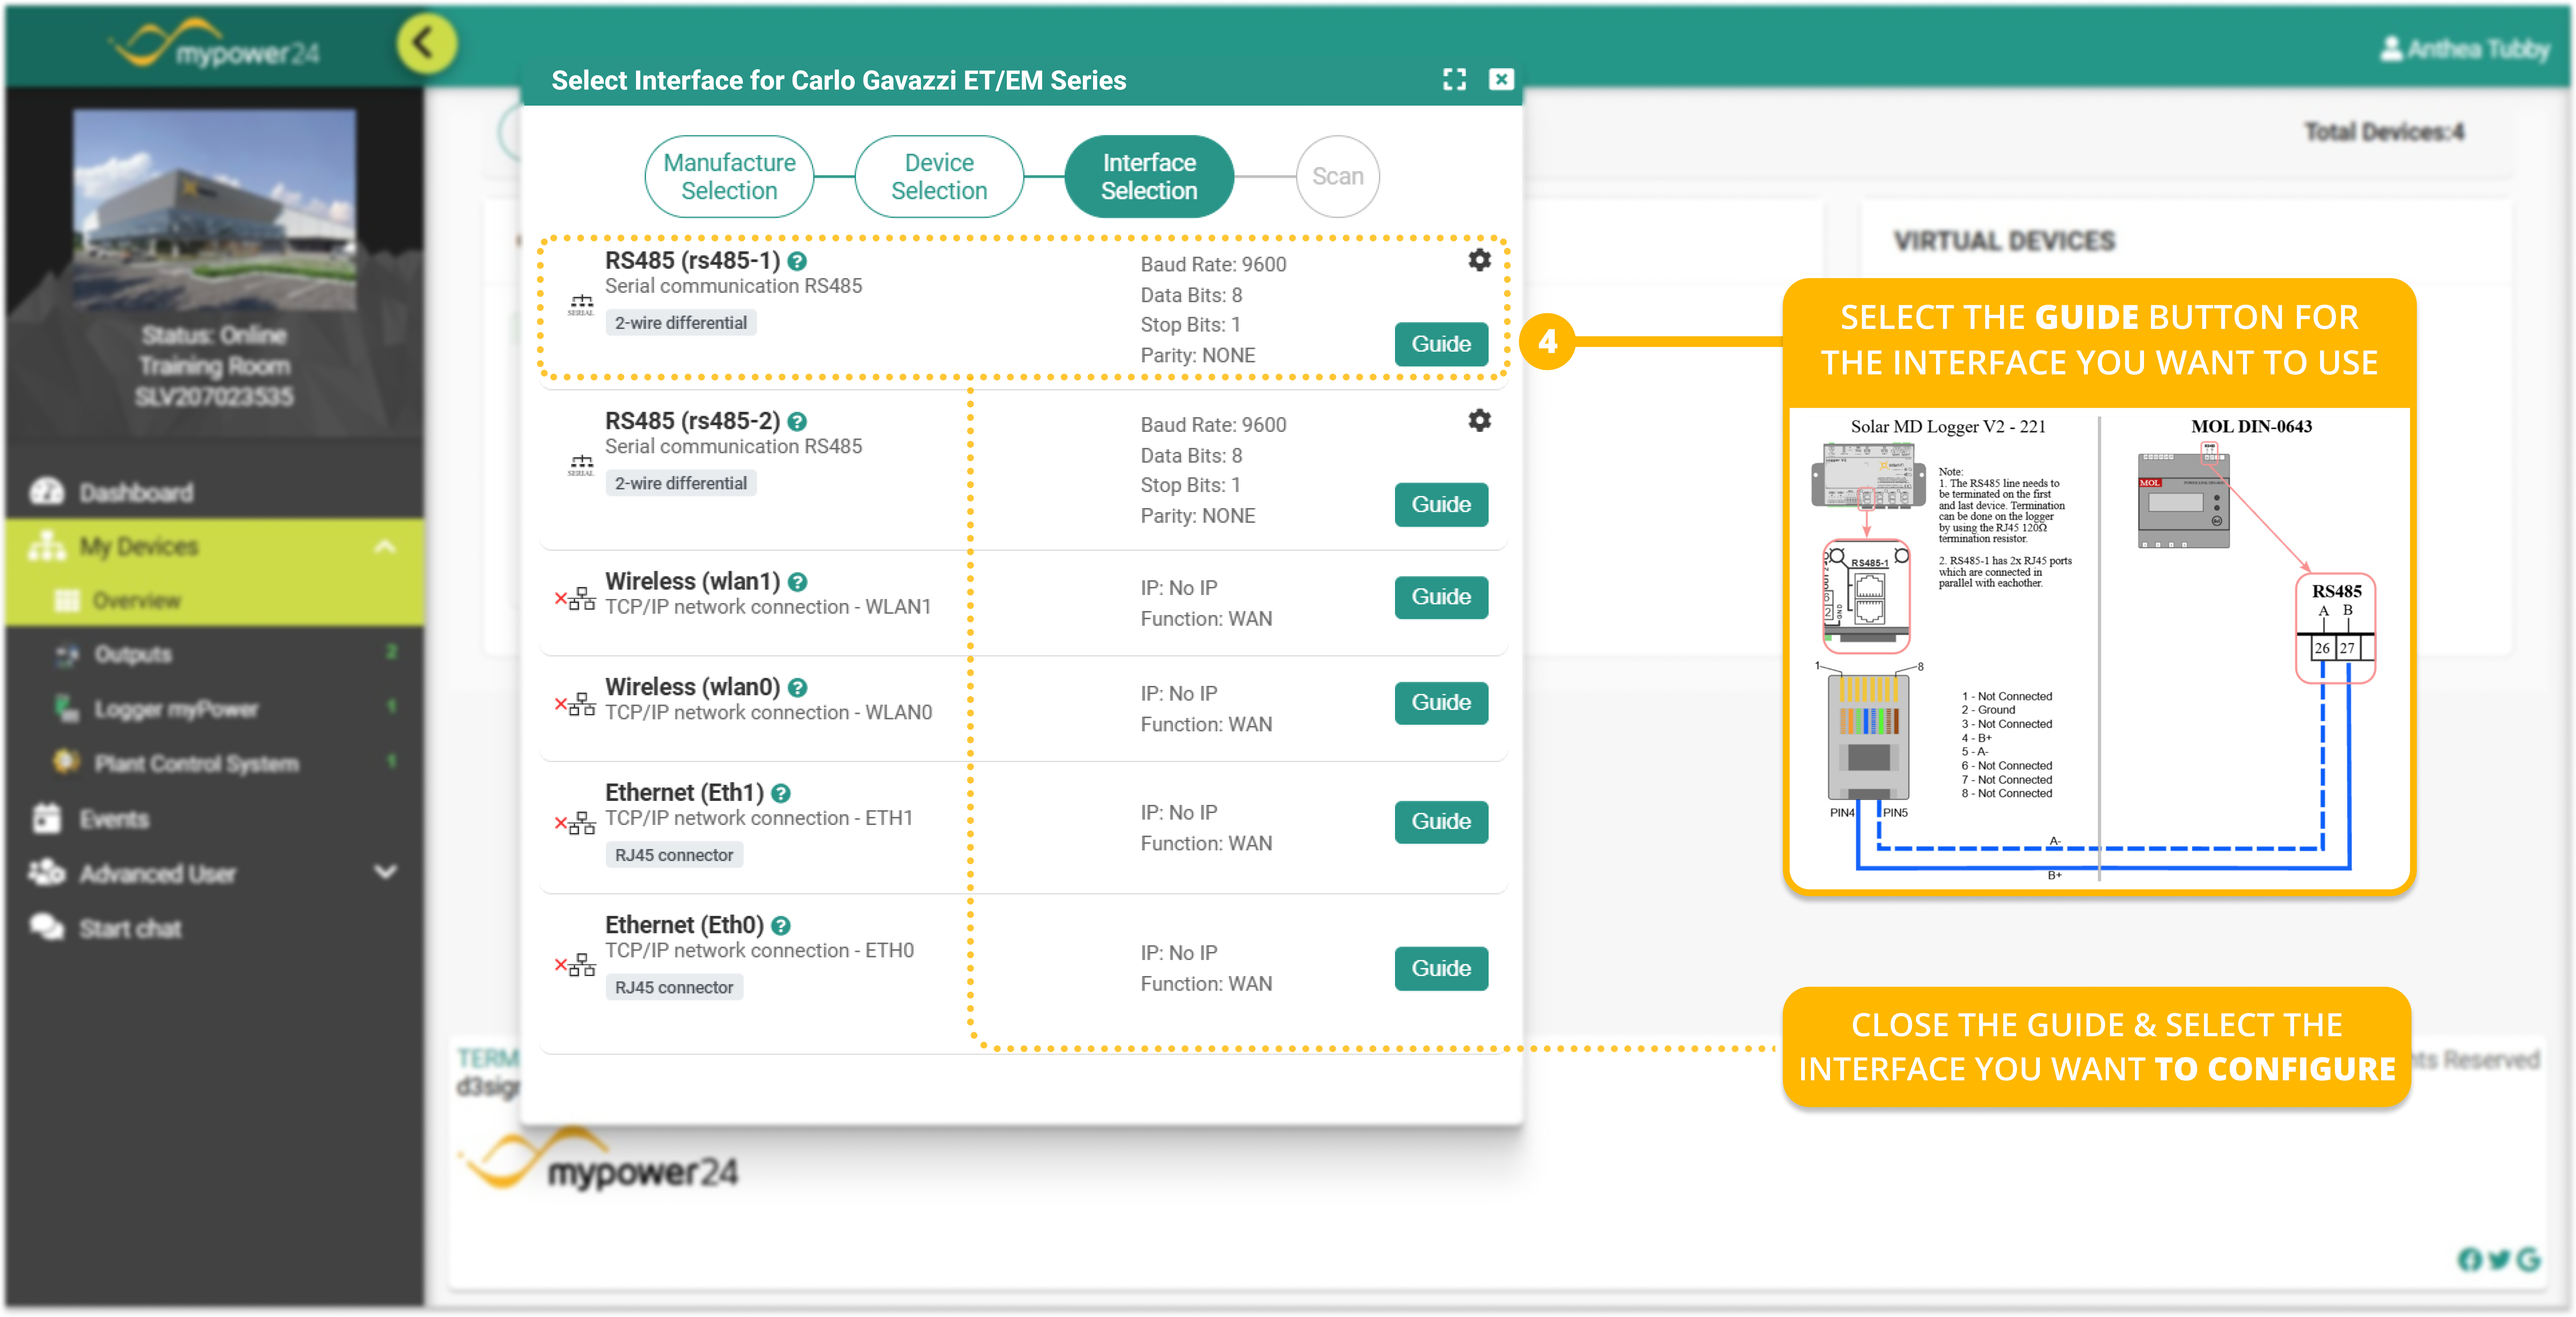
- Interface Selection: Before proceeding, select the Guide button for the interface you want to use. Verify that the physical device is wired as the dynamic wiring guide instructs, close the wiring guide and select the interface you are using.
- There are three possible ways to connect a device: RS485, Wireless, or Ethernet. Each option has a distinct wiring guide .
- If the physical wiring does not match the diagram for the option you select in the portal, the device will not be detected during the scan.
- Configure: You will be prompted to enter IP address, TCP port and/or Modbus Slave ID. Enter the necessary information and select Try to connect
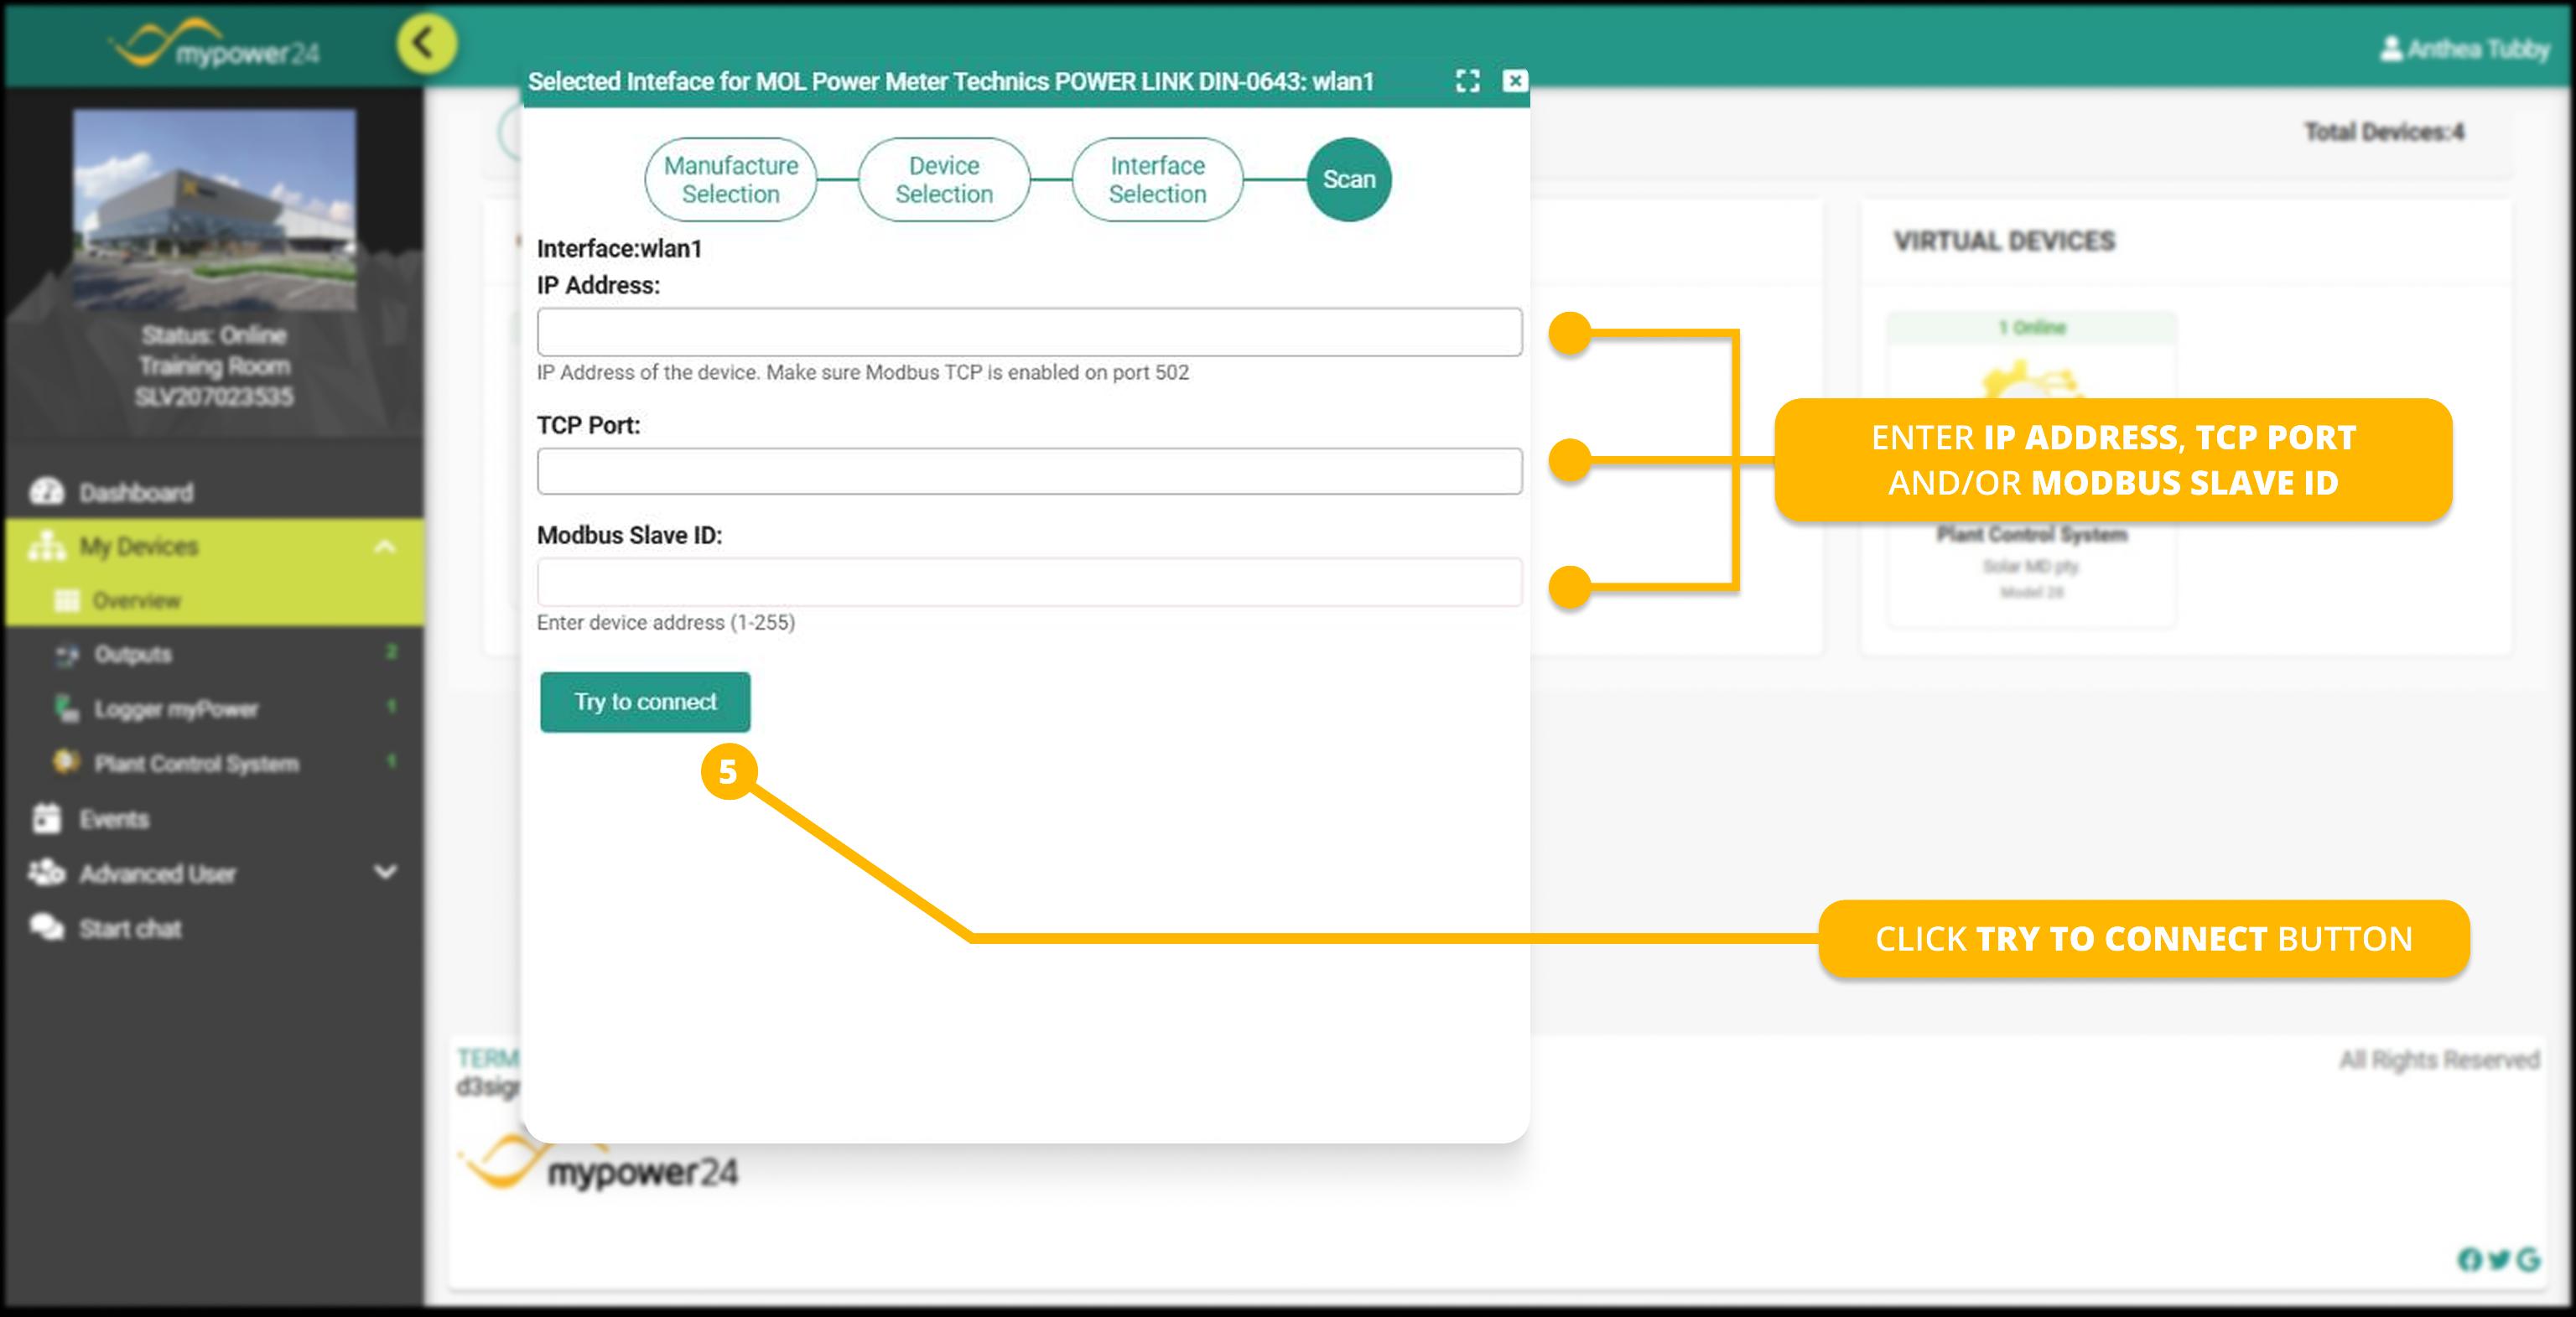
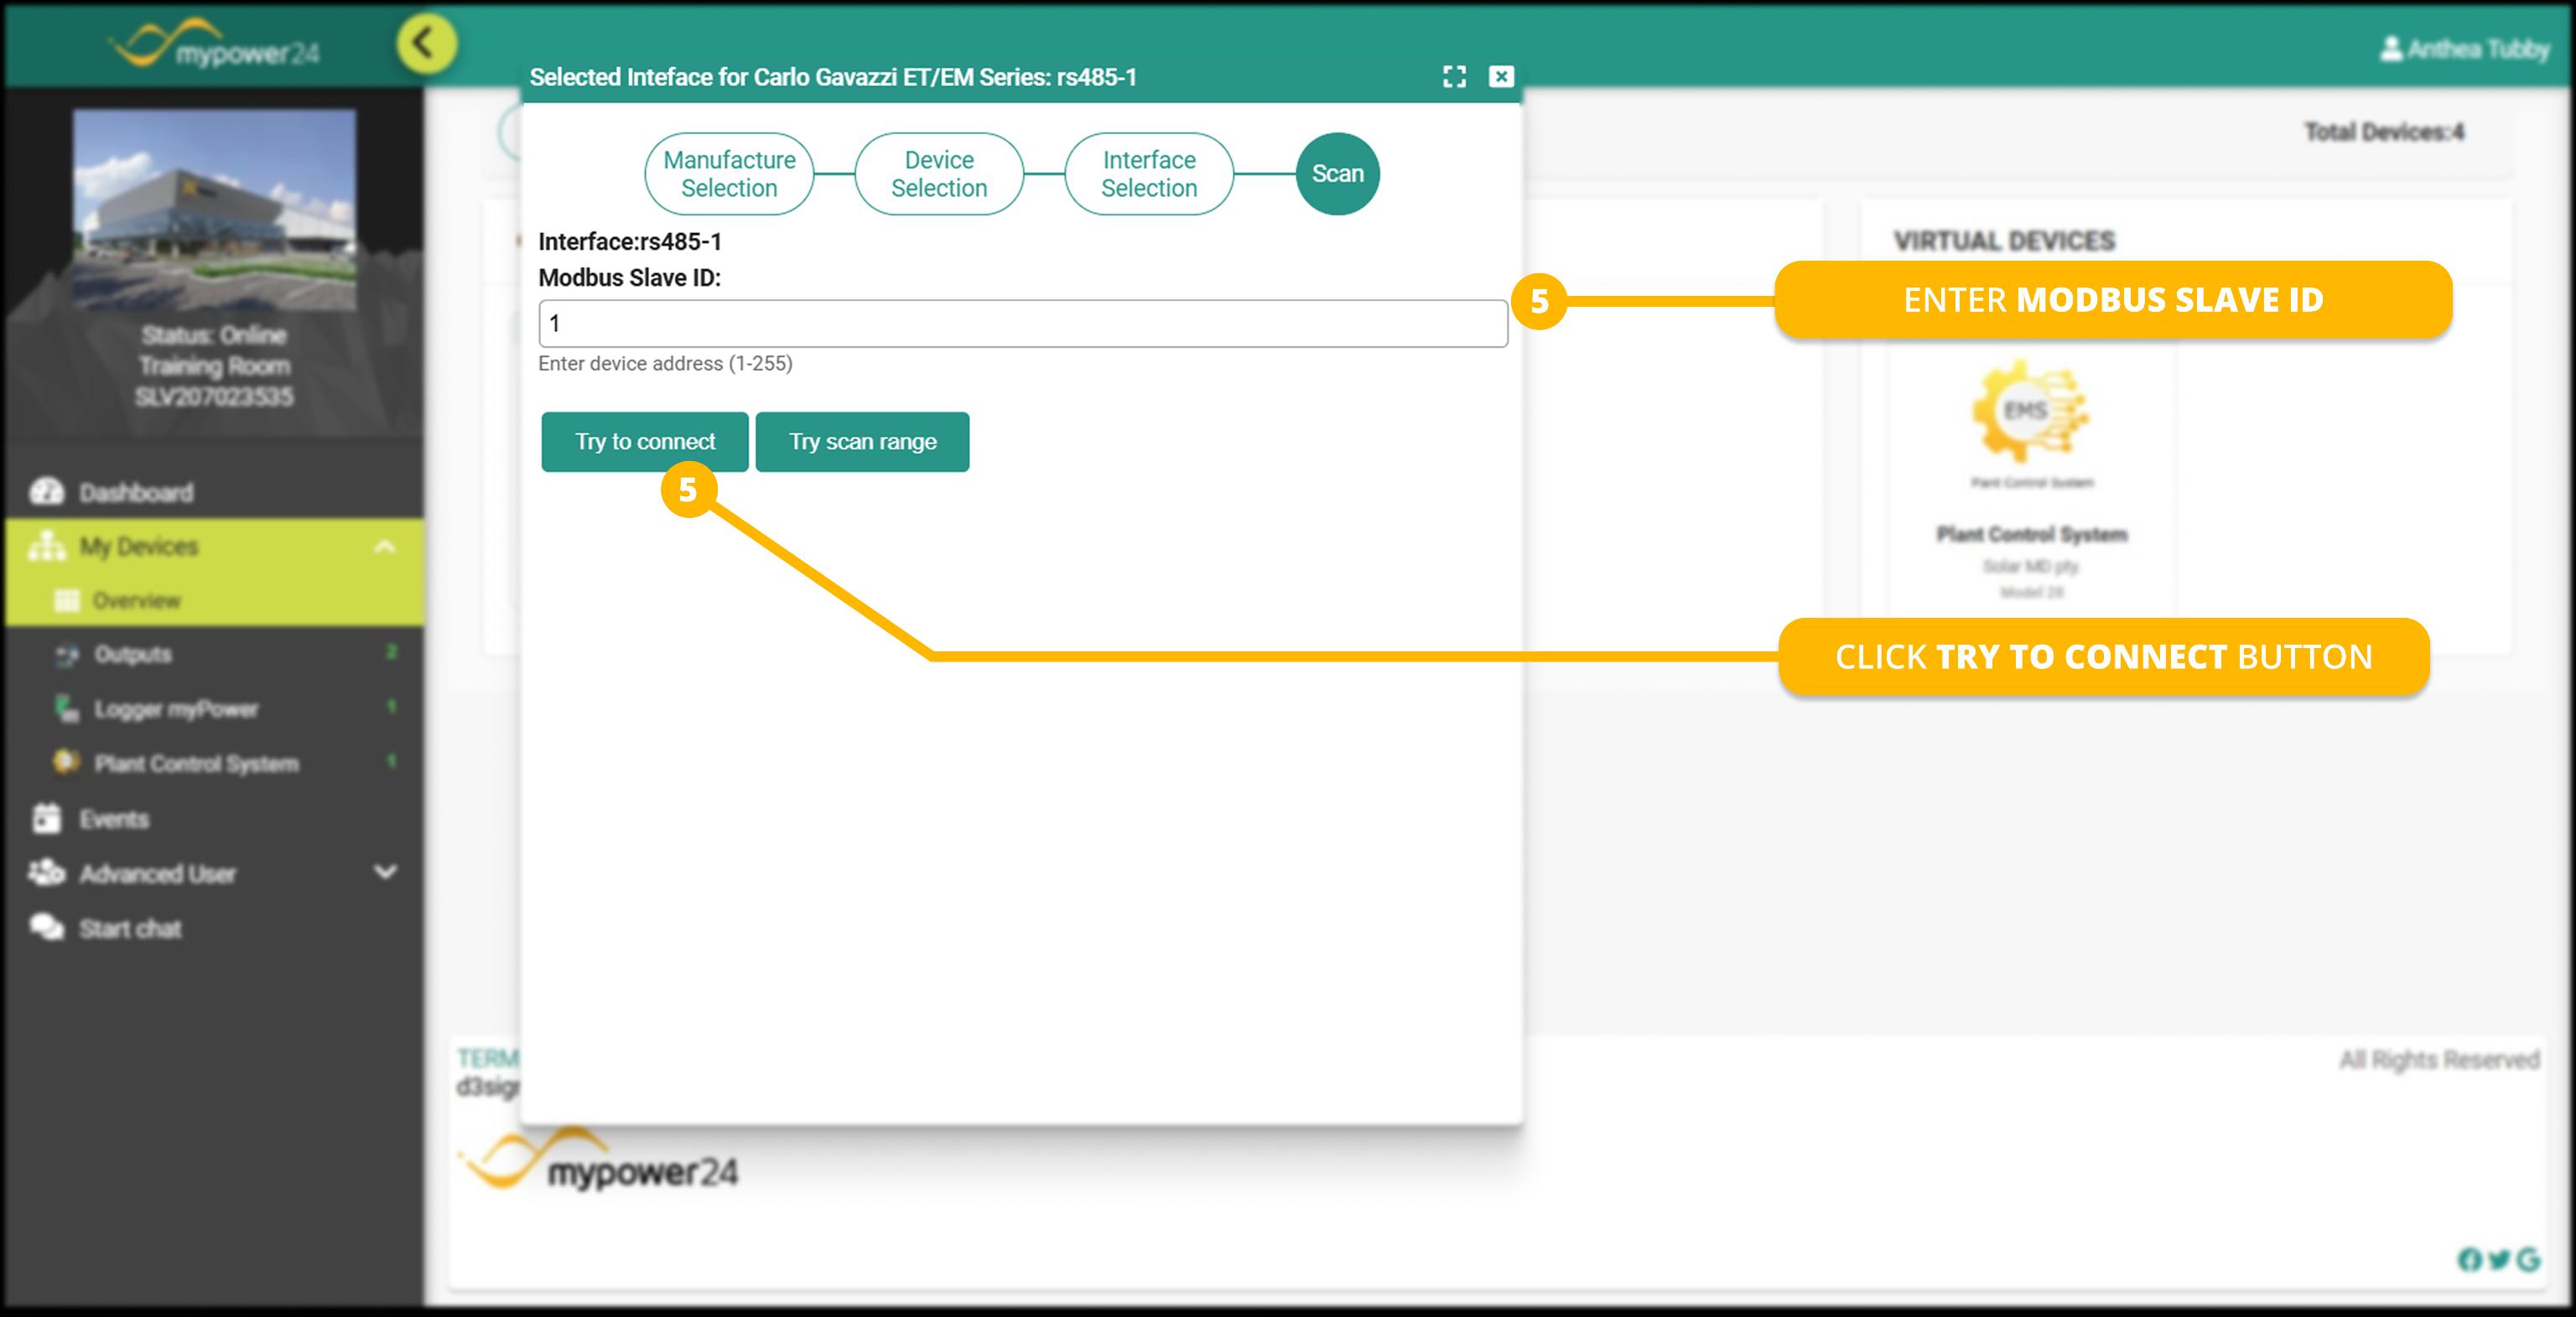
If you do not know where to find your IP Address, please contact your network administrator. The TCP port as well as Modbus slave ID can be found in the device manual.
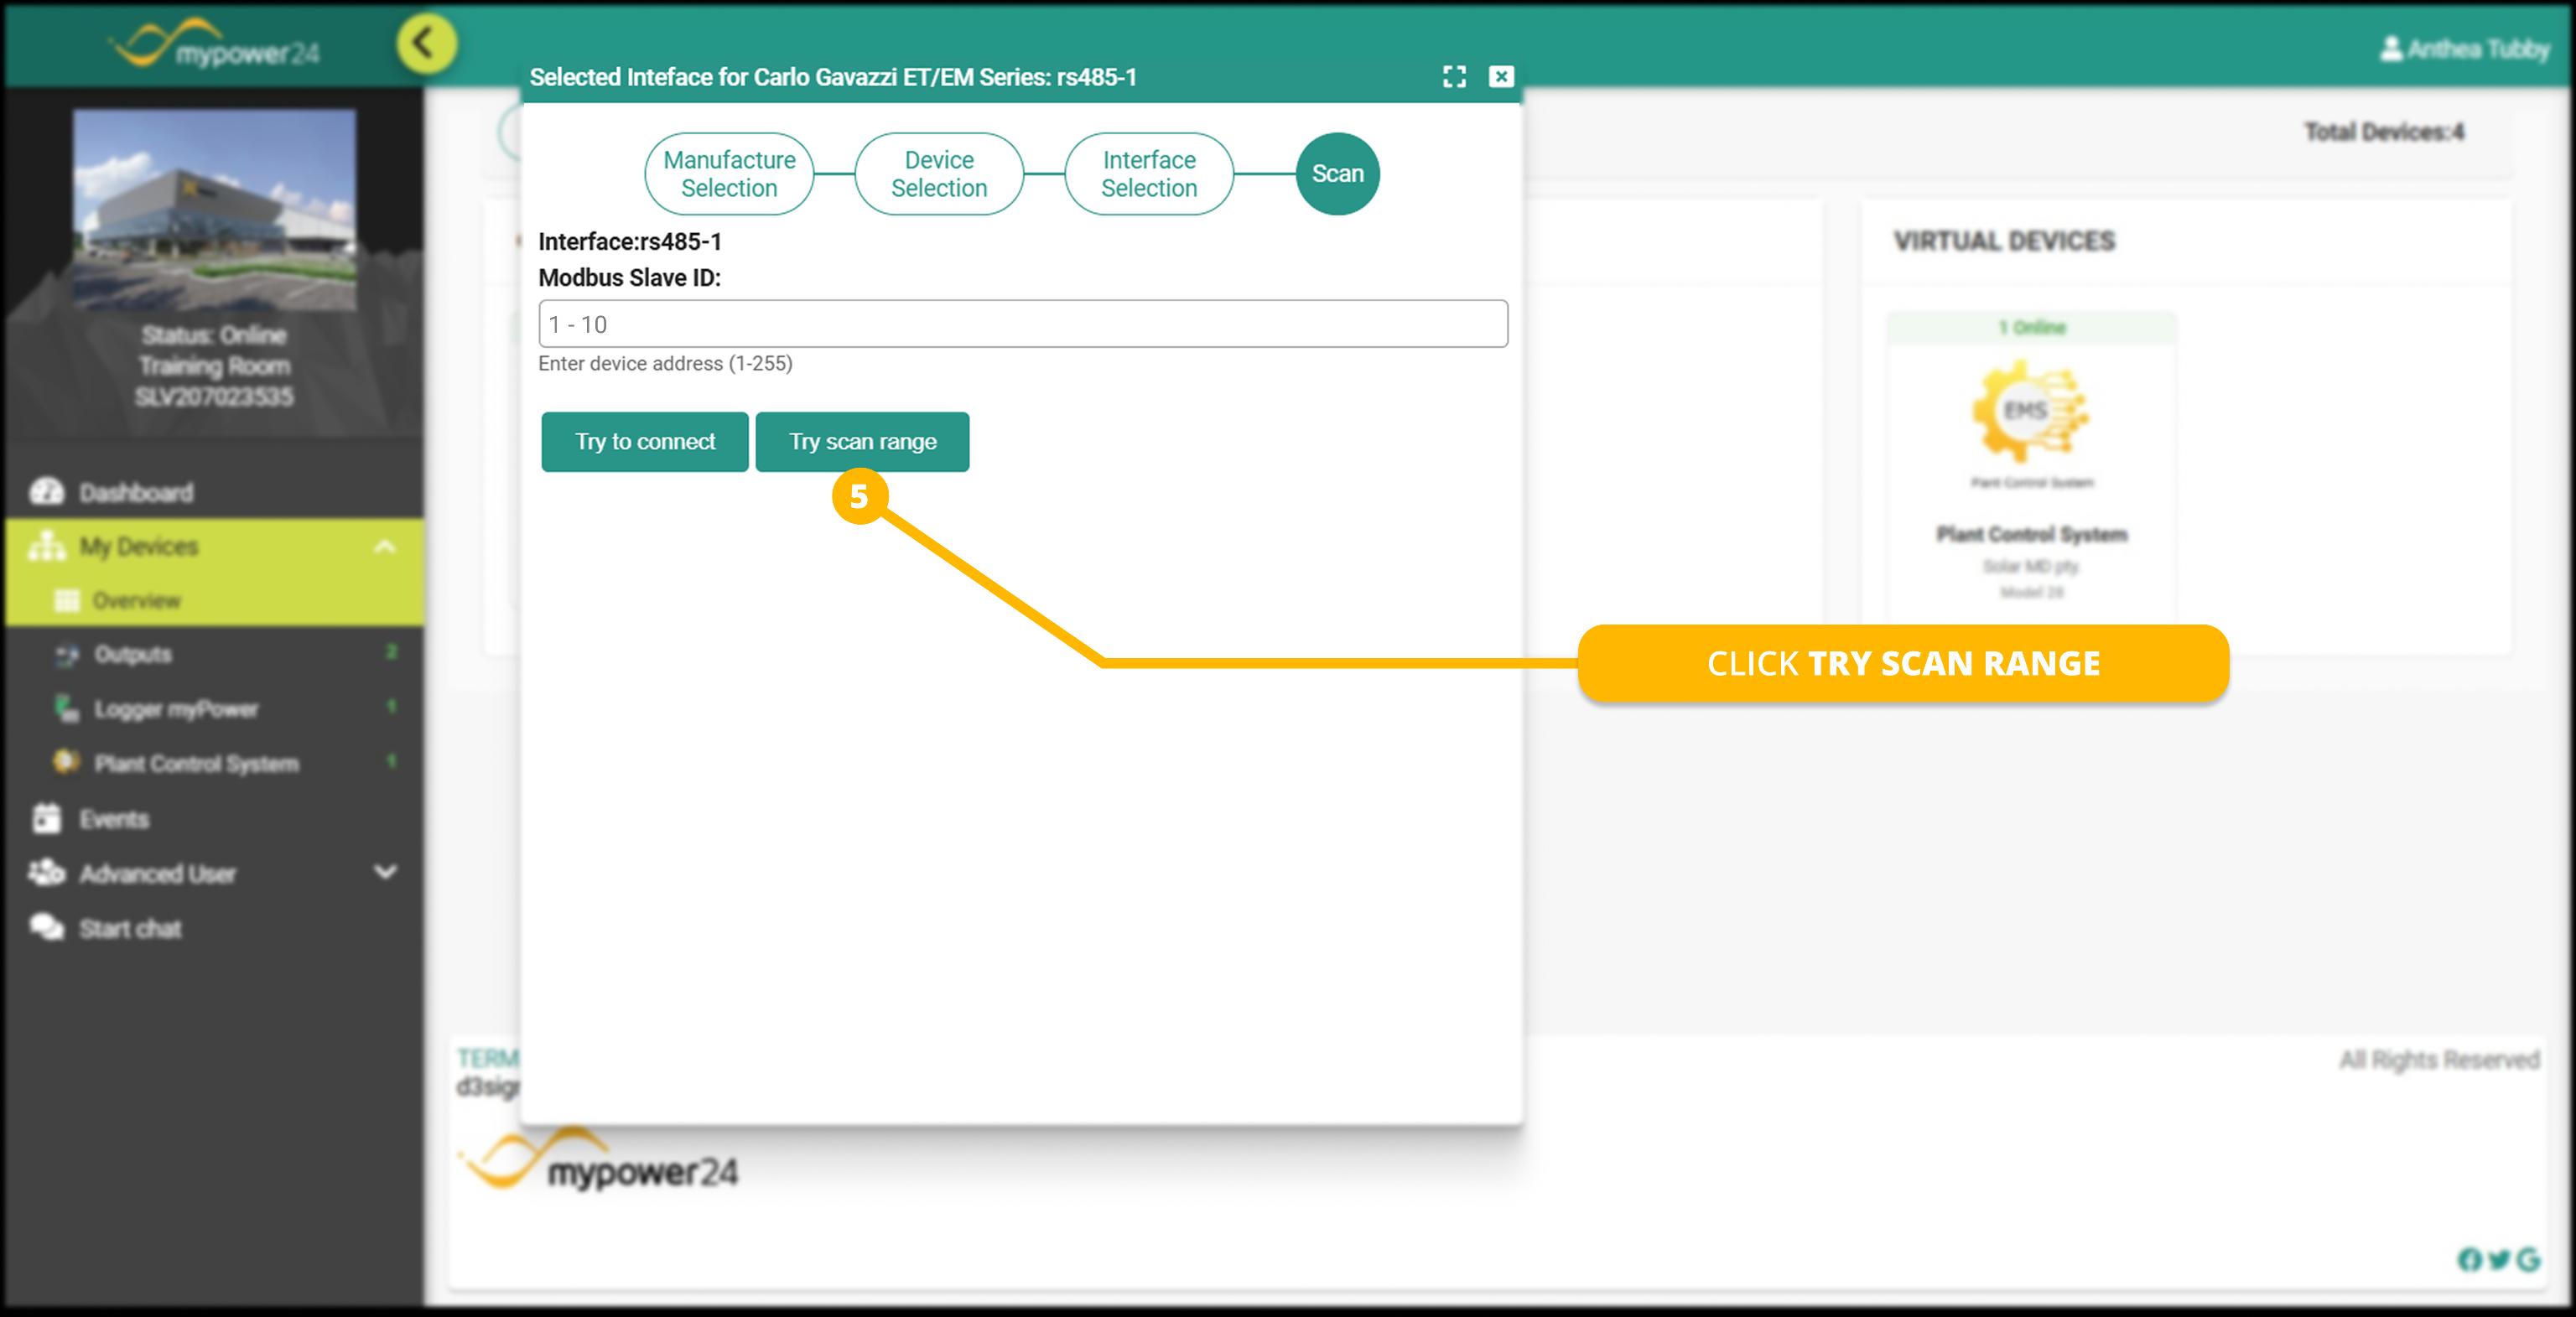
- Unknown Modbus Slave ID: If you are prompted for a Modbus Slave ID but are unaware of the correct one, select the Try scan range button.
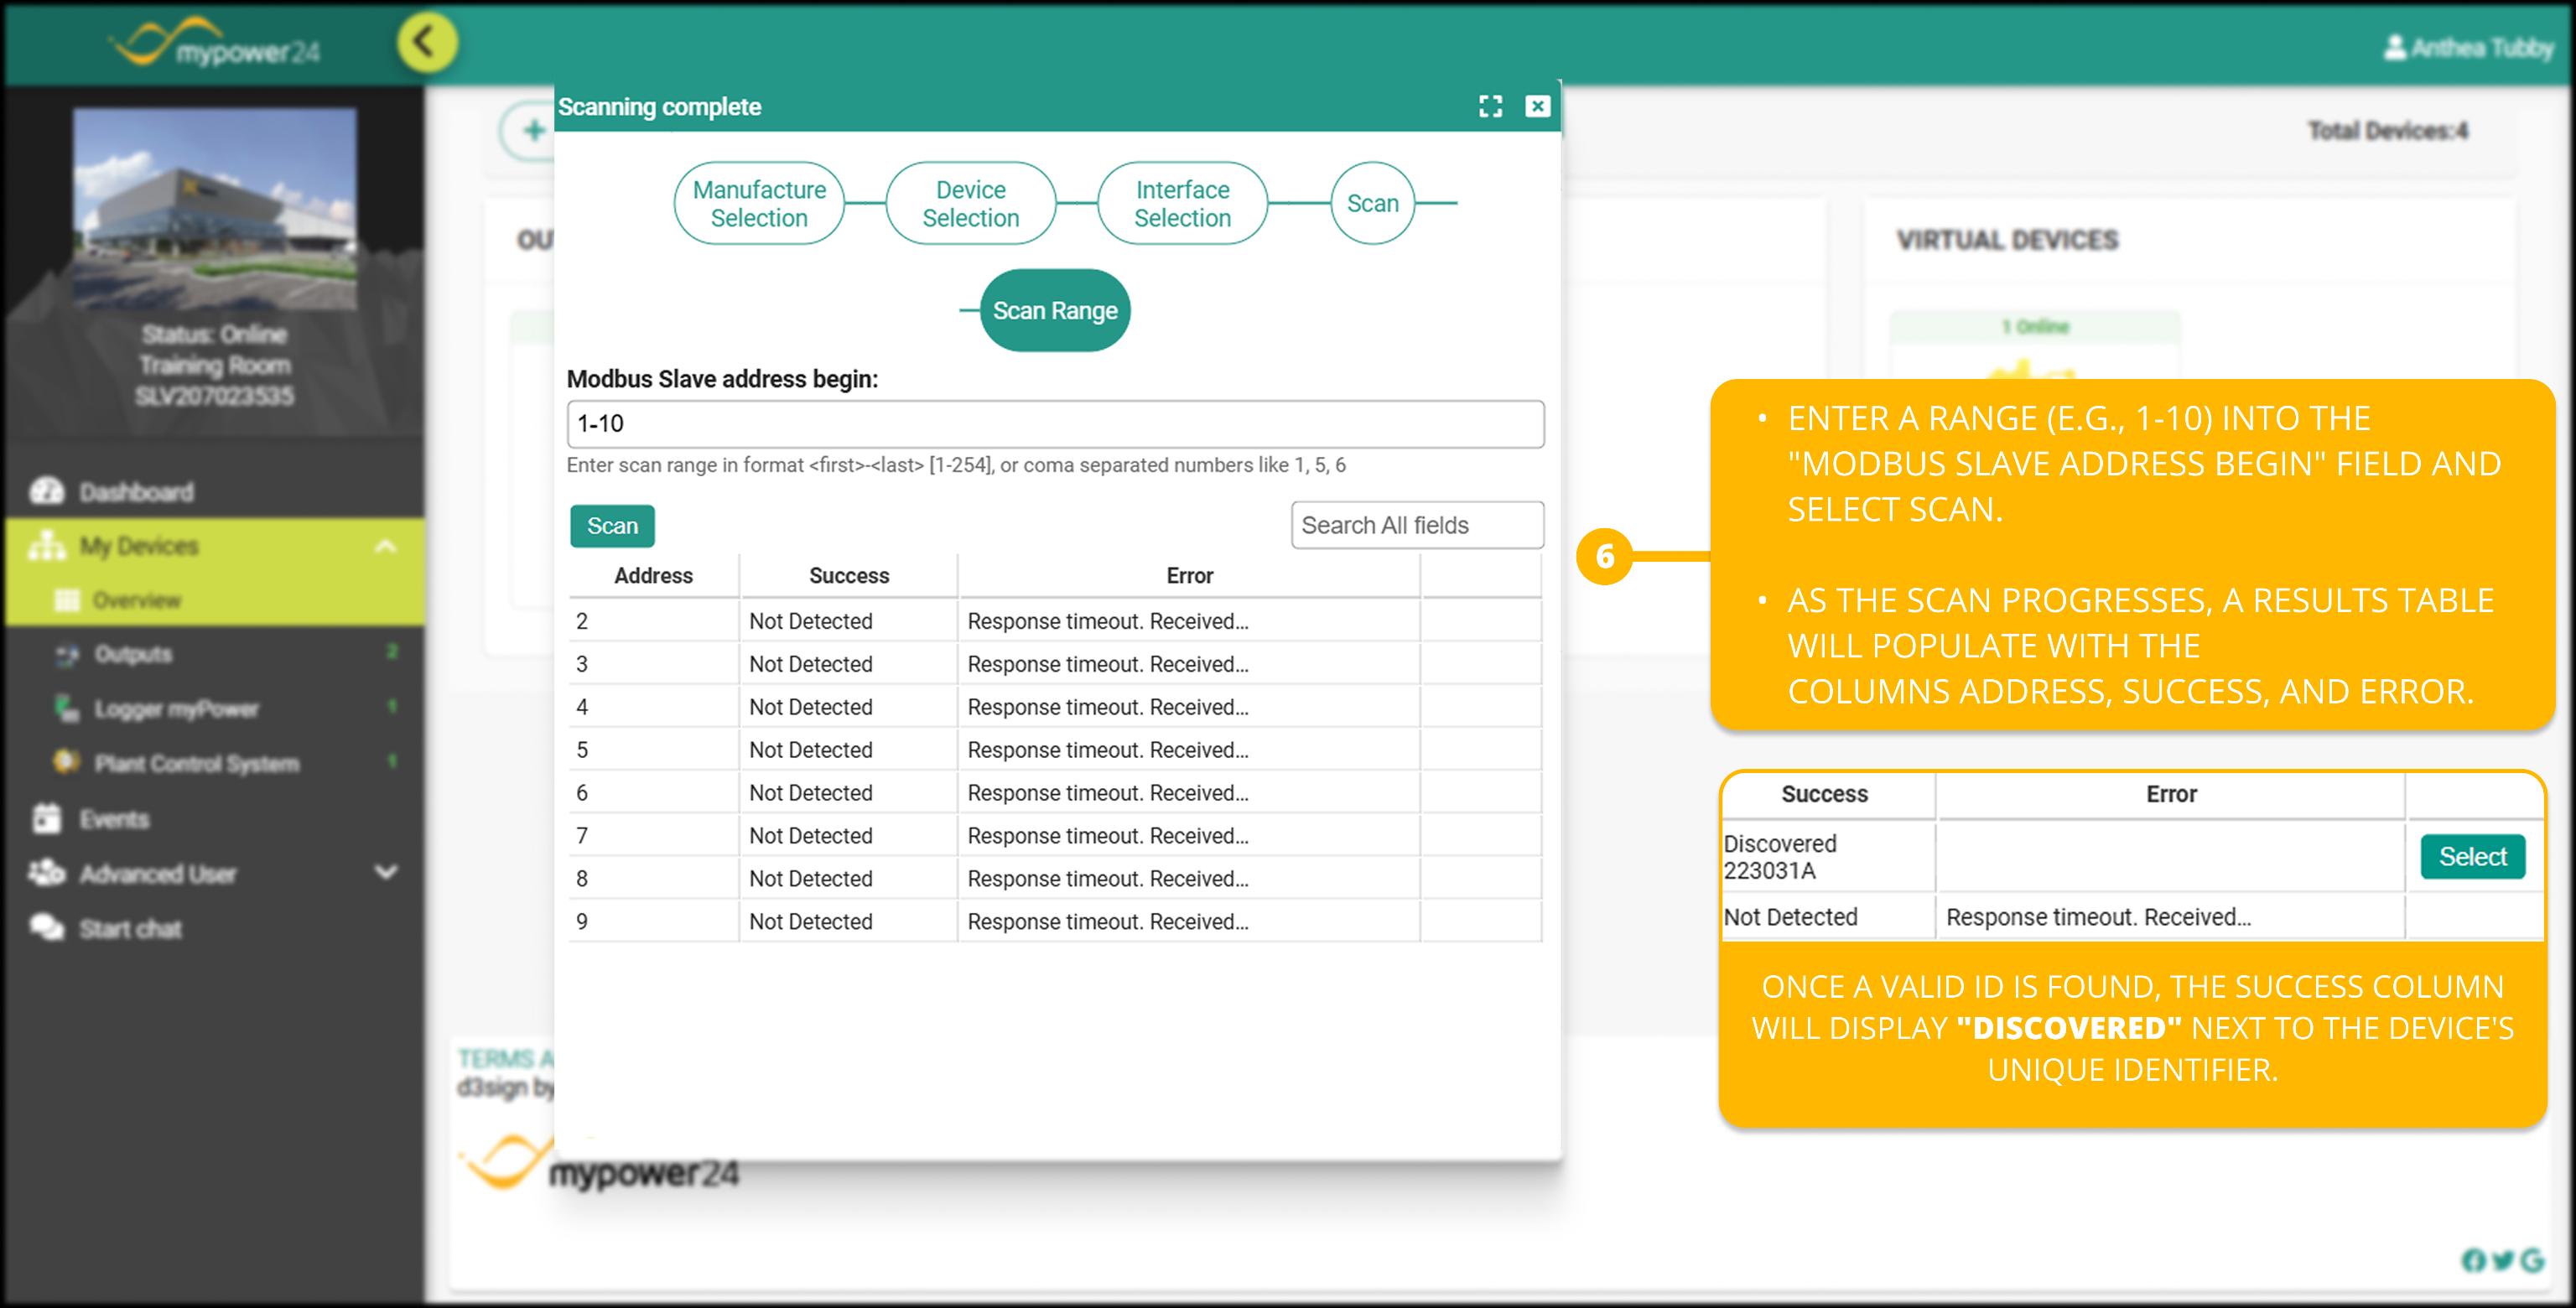
- Enter a range (e.g., 1-10) into the "Modbus Slave address begin" field and select Scan. As the scan progresses, a results table will populate with the columns Address, Success, and Error.
- Once a valid ID is found, the corresponding row in the Success column will display "Discovered" next to the device's unique identifier.
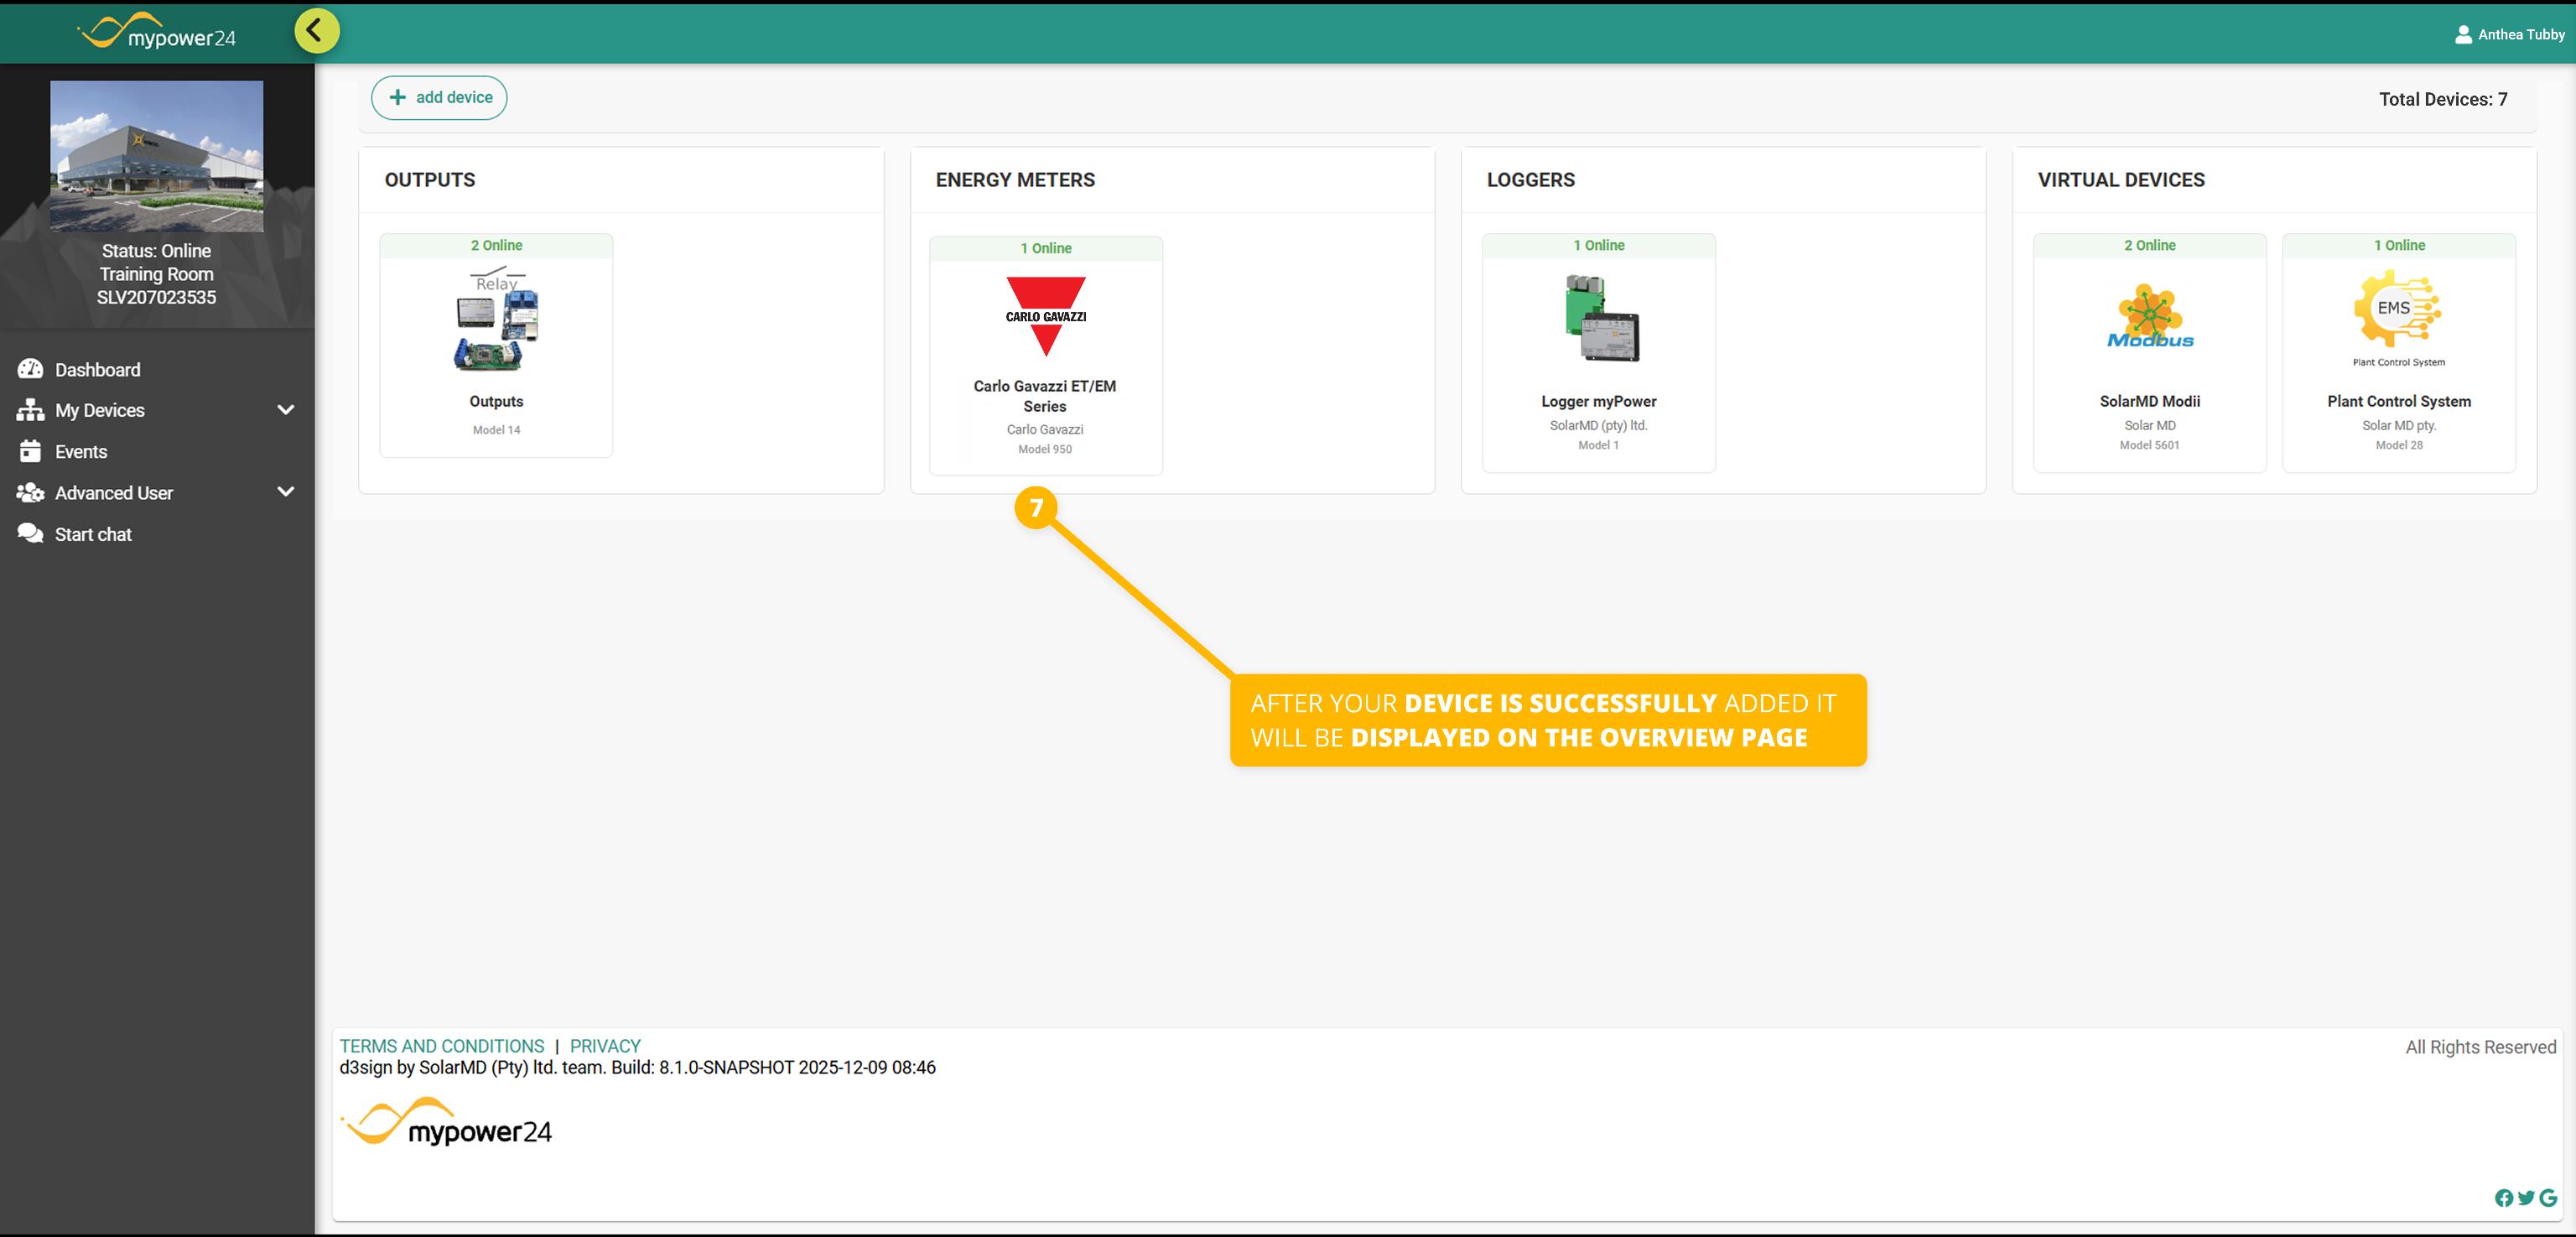
- Once the device has been added successfully the Overview should now display the new device.
¶ 4. Finalizing Integration
Once the device is successfully detected:
- The system will begin logging variables such as Active Power, Voltage, and Frequency based on the predefined recording intervals.
- Ensure all data points are populating correctly in your Dashboard or Plant Control System.